
Last Updated on July 21, 2018
Hi and welcome to another tutorial from Codingdemos, in this tutorial you will learn how to create pie chart in Android Studio. You will be building an app that will show a quarterly sales of a company for the year inside a pie chart graph.

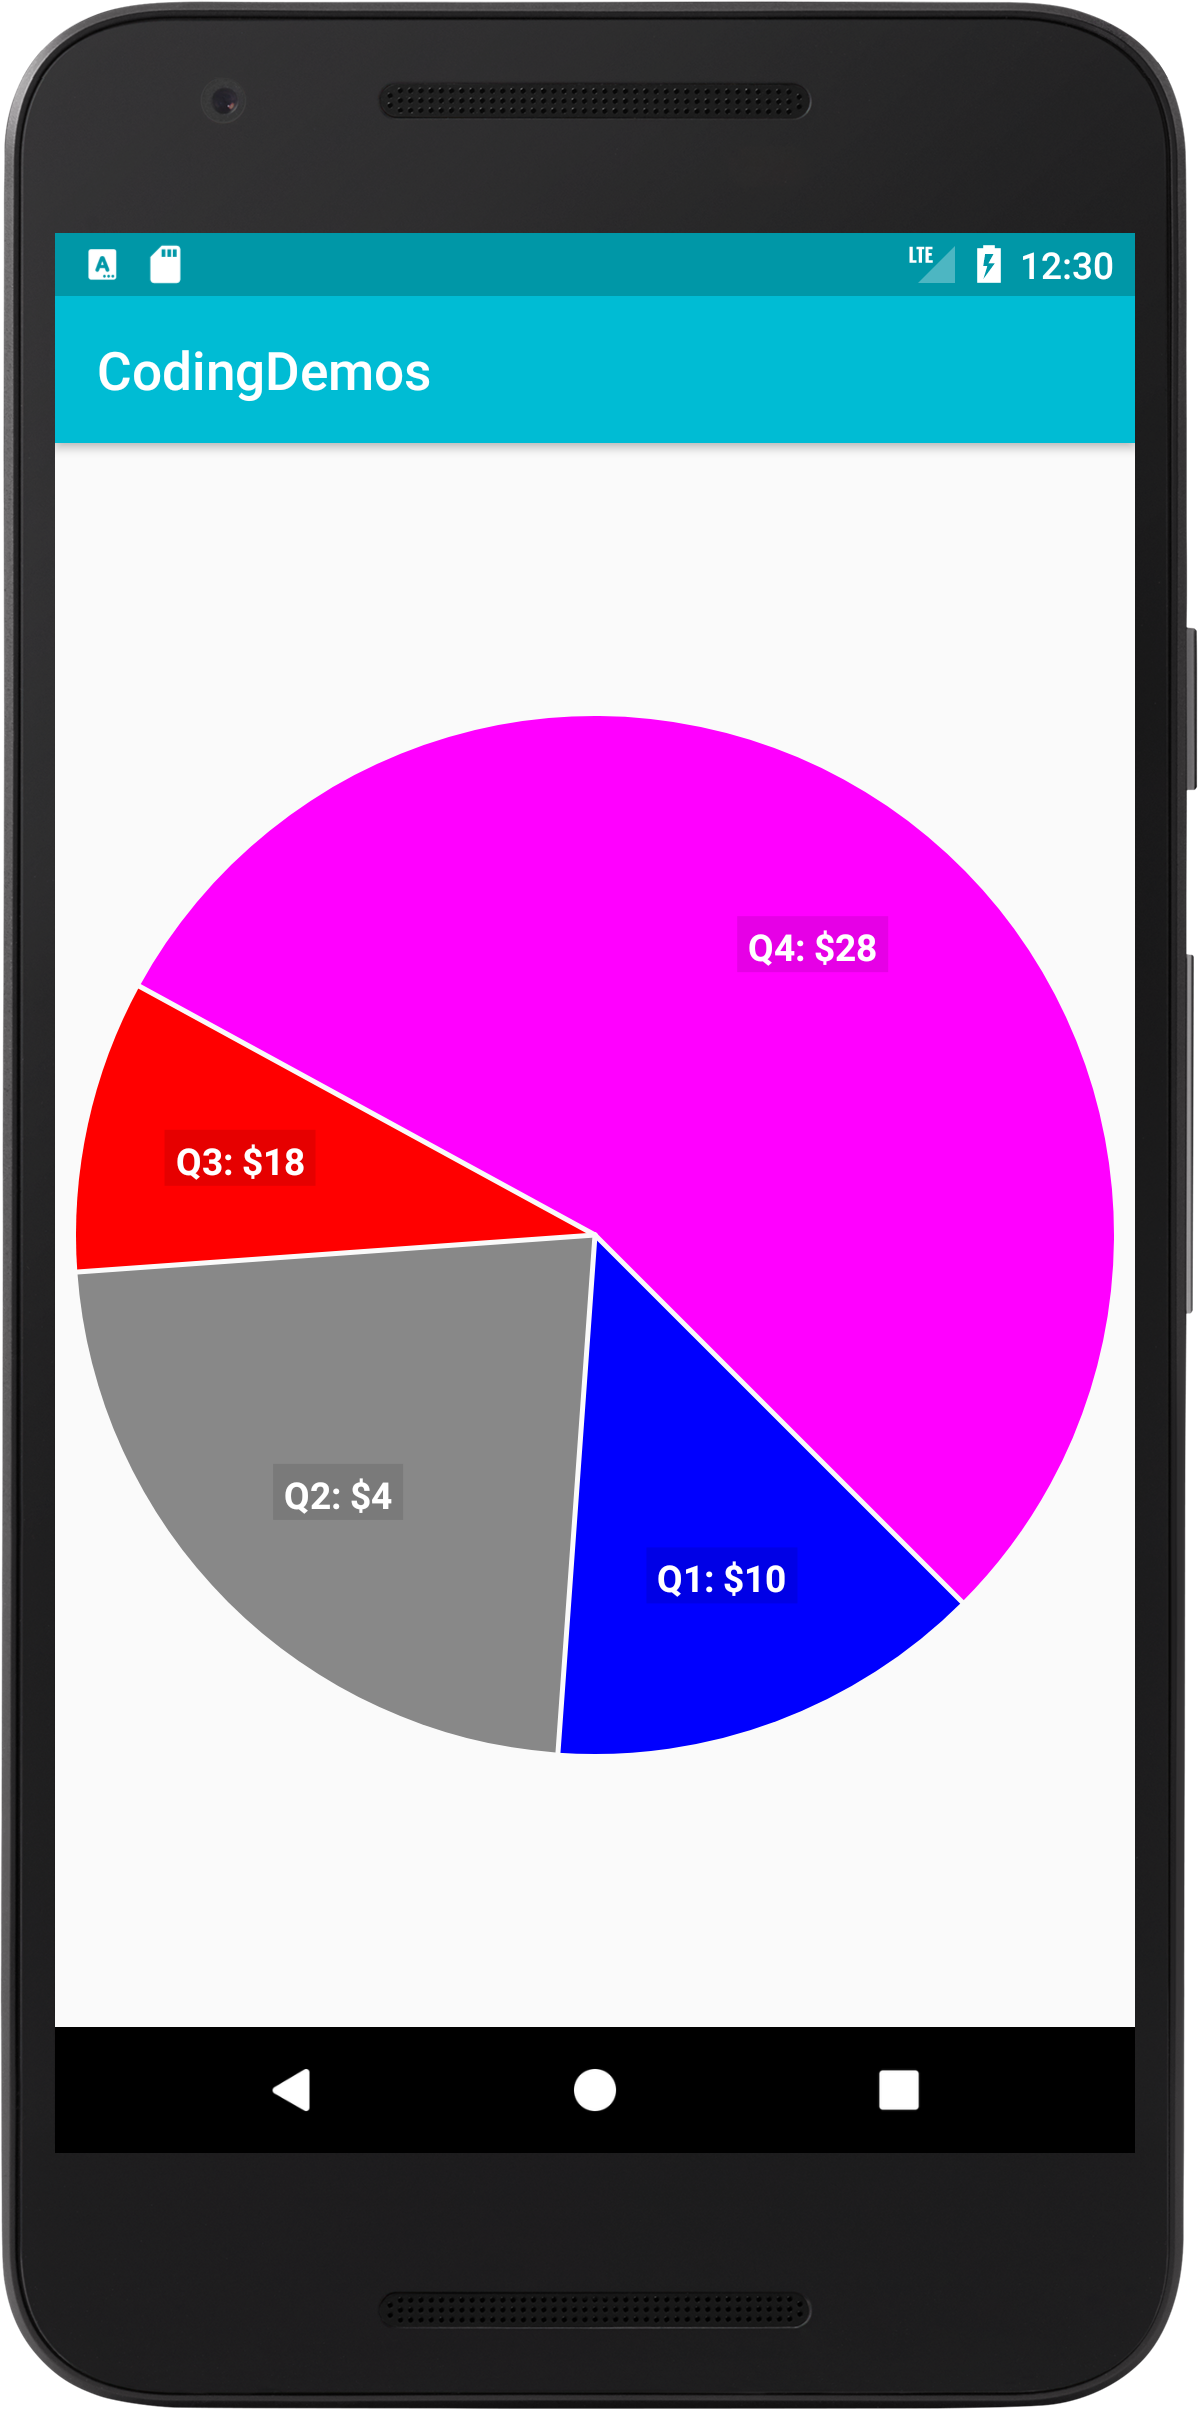
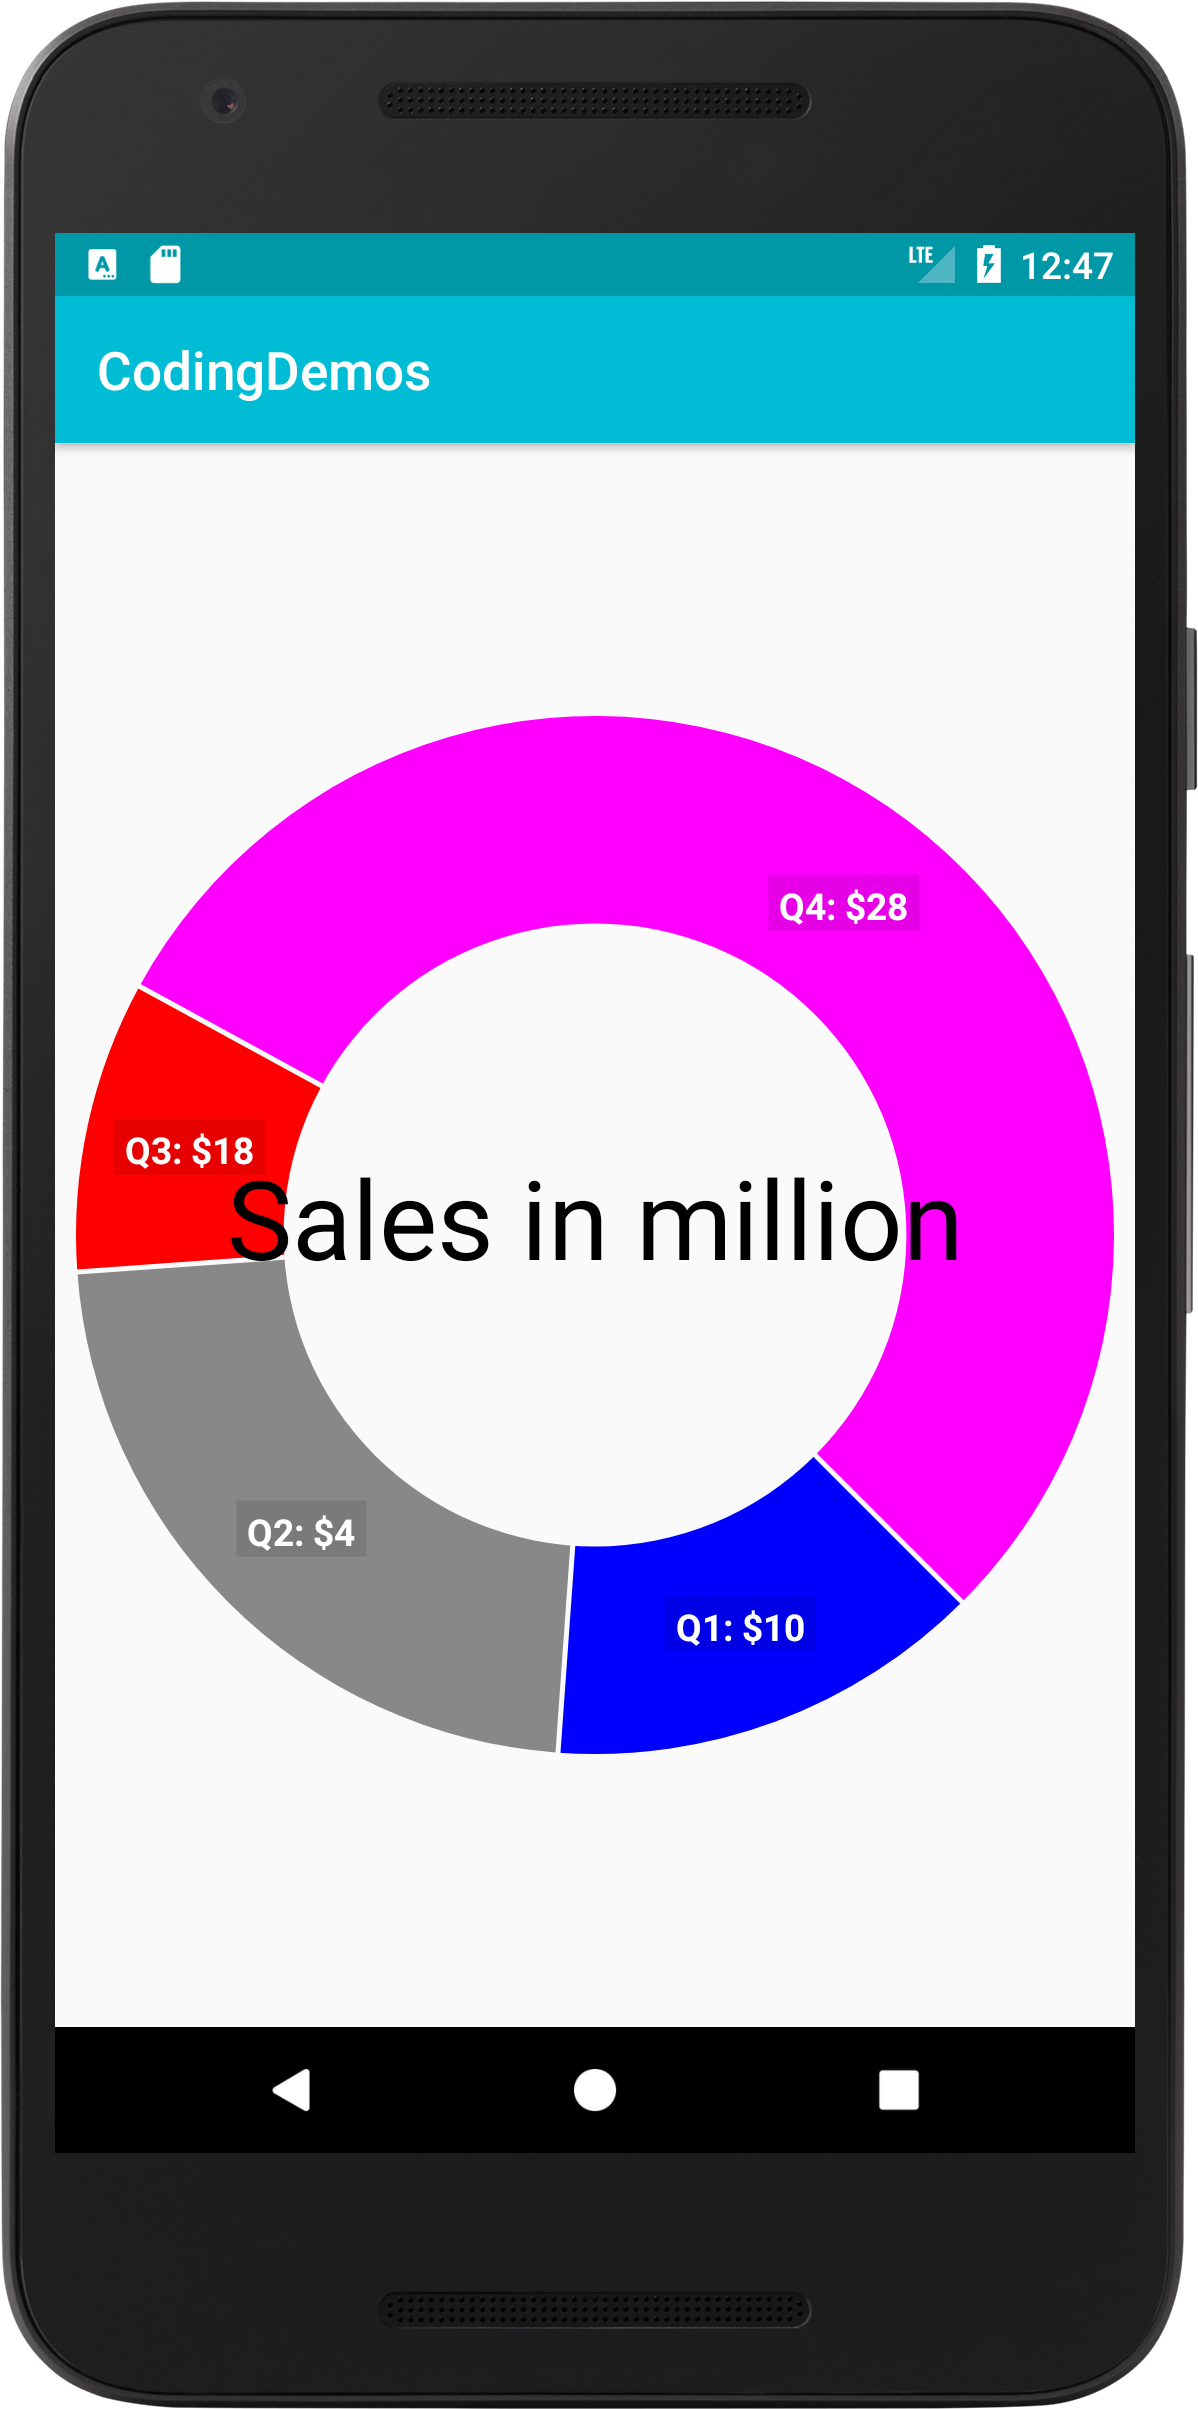
By the end of this tutorial, you will have an app that looks like this. (Large preview)
You will be using a 3rd party library called Hellocharts-Androidto help you build Android pie chart.
Check out the previous tutorial if you are interested in learning how to draw line chart in Android.
In this tutorial we will be using the following:
– Android studio version 3.0.1
– Android emulator Nexus 5X with API 26
– Minimum SDK API 16
1- Open up Android Studio and open any project that you have in your computer.
Create new Android Studio project or open existing project. (Large preview)
2- Open up build.gradle (module:app) and add the library in the dependencies.
implementation 'com.github.lecho:hellocharts-library:1.5.8@aar'
3- Next you need to open up build.gradle (Project) and add Jcenter because this library is available through it.
allprojects {
    repositories {
        google()
        jcenter()
    }
}
4- Now sync your project by clicking on Sync Now.

Android studio sync project. (Large preview)
5- Open up colors.xml file to change the colors of the main app.
< color name="colorPrimary">#00BCD4< /color>
< color name="colorPrimaryDark">#0097A7< /color>
< color name="colorAccent">#009688< /color>
6- Build and run the app to see the new colors.
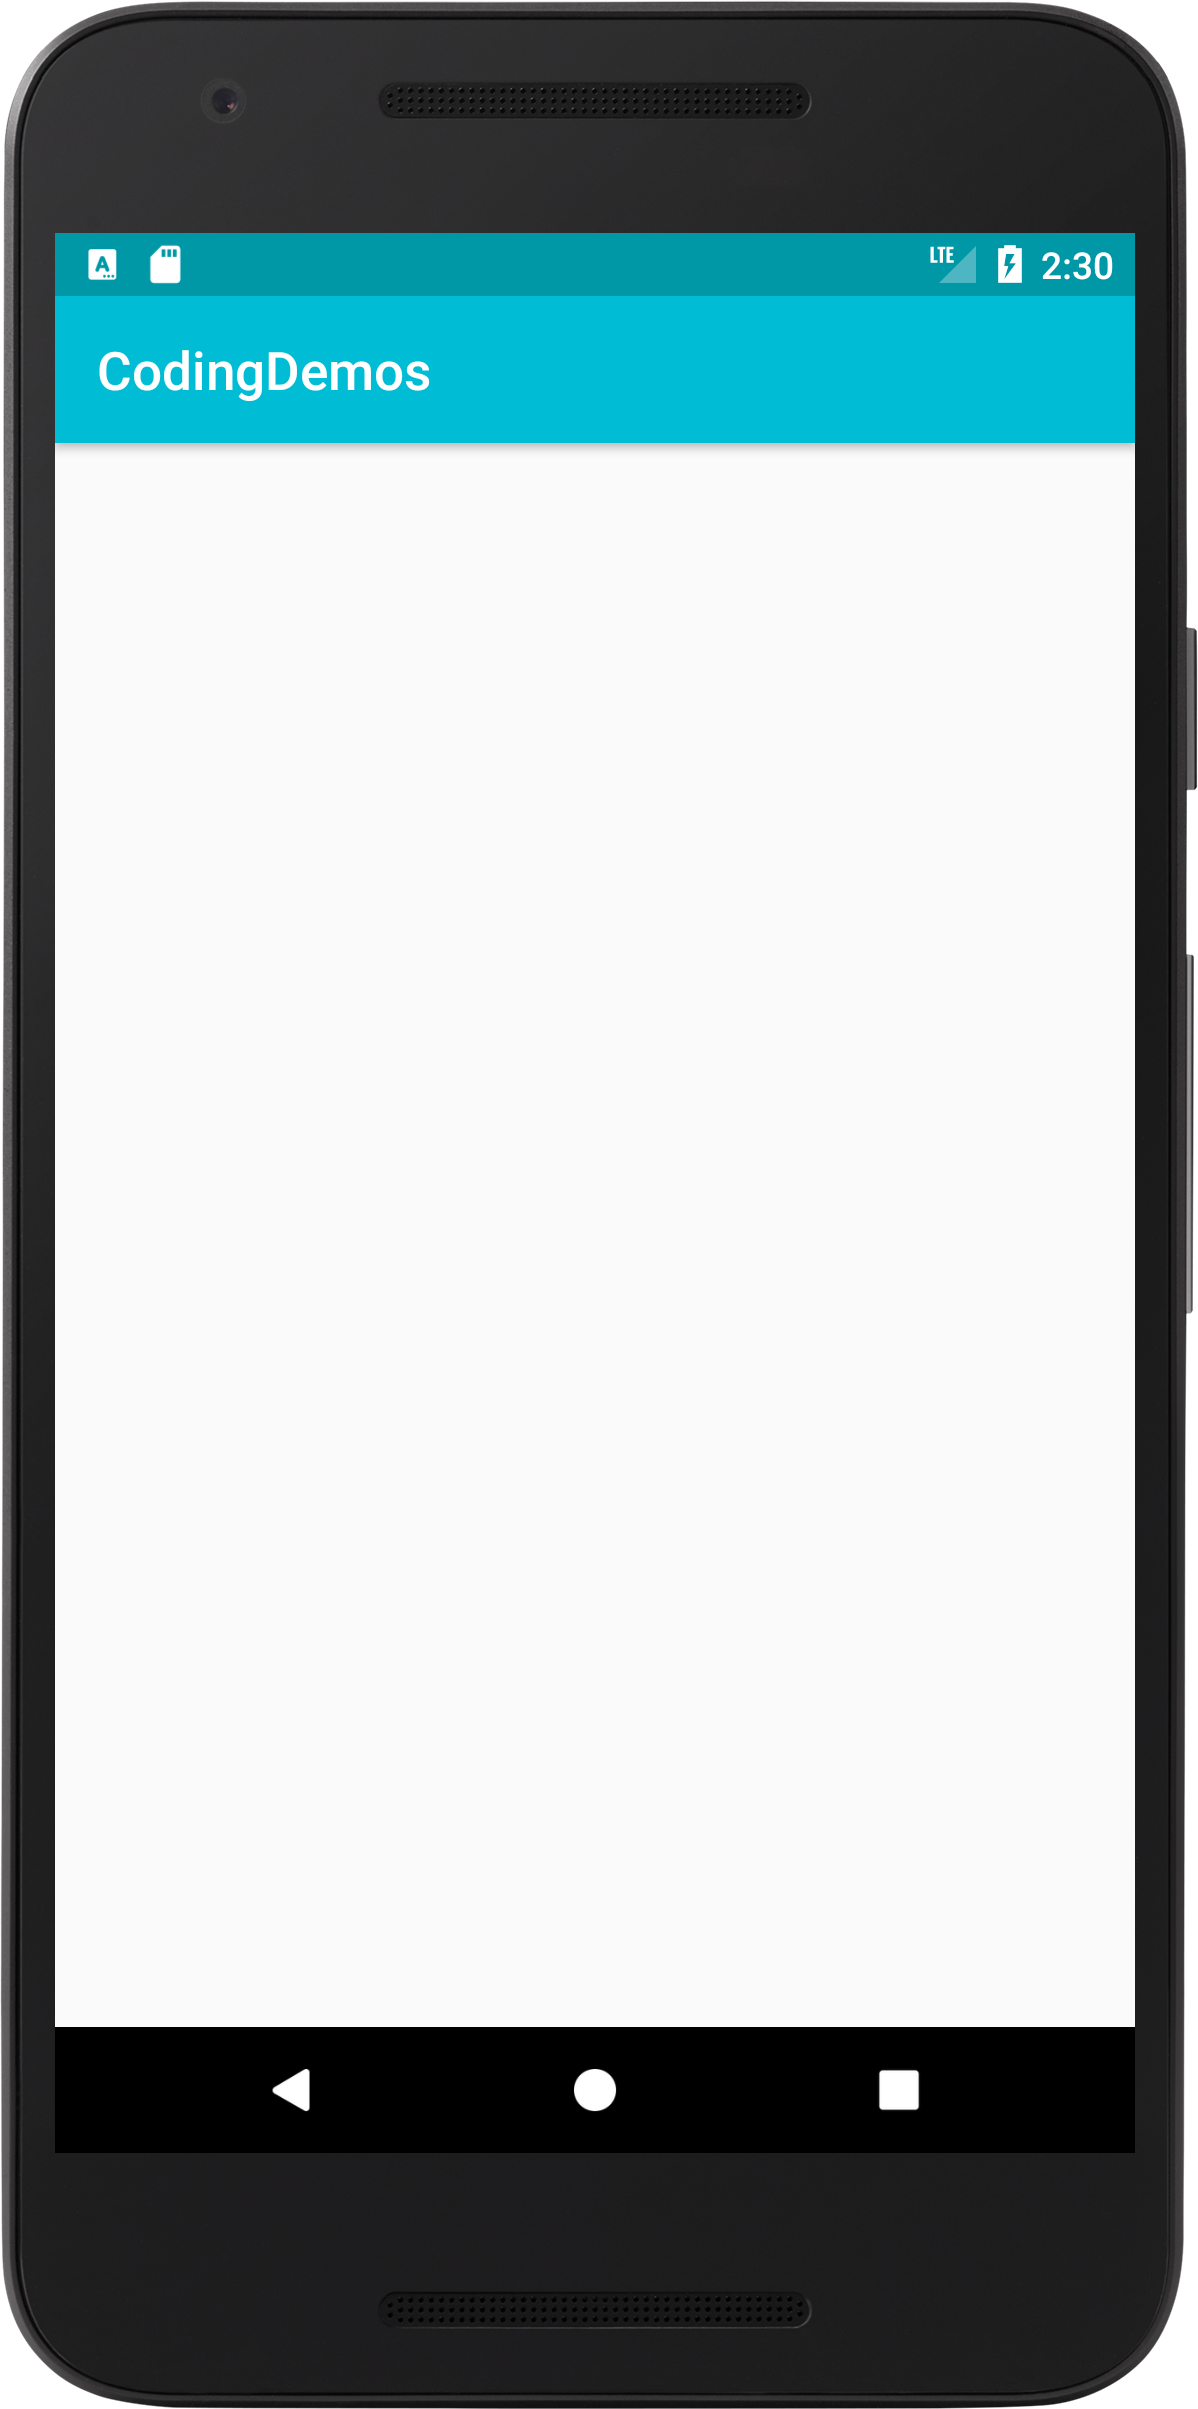
New colors for the app. (Large preview)
7- Open up activity_main.xml and add the following code for Android pie chart view.
< lecho.lib.hellocharts.view.PieChartView
    android:id="@+id/chart"
    android:layout_width="match_parent"
    android:layout_height="match_parent" />
8- Next you need to reference pie chart view inside MainActivity.java file.
PieChartView pieChartView = findViewById(R.id.chart);
9- Now you need to initialize the data which will appear later inside Android pie chart. You will do that by declaring List of a type SliceValue like the following.
List< SliceValue > pieData = new ArrayList<>();
10- You can add data inside pieData list like this.
pieData.add(new SliceValue(15, Color.BLUE));
pieData.add(new SliceValue(25, Color.GRAY));
pieData.add(new SliceValue(10, Color.RED));
pieData.add(new SliceValue(60, Color.MAGENTA));
SliceValue will take 2 arguments:
- Float value which represent the size of pie chart.
- Color which you can set for that particular pie chart
11- Create PieChartData so that you can pass pie chart data inside this model.
PieChartData pieChartData = new PieChartData(pieData);
12- Next you can set the pie chart data inside pieChartView to be able to see the actual data appears inside Android pie chart.
pieChartView.setPieChartData(pieChartData);
13- Build and run the app to see the result.
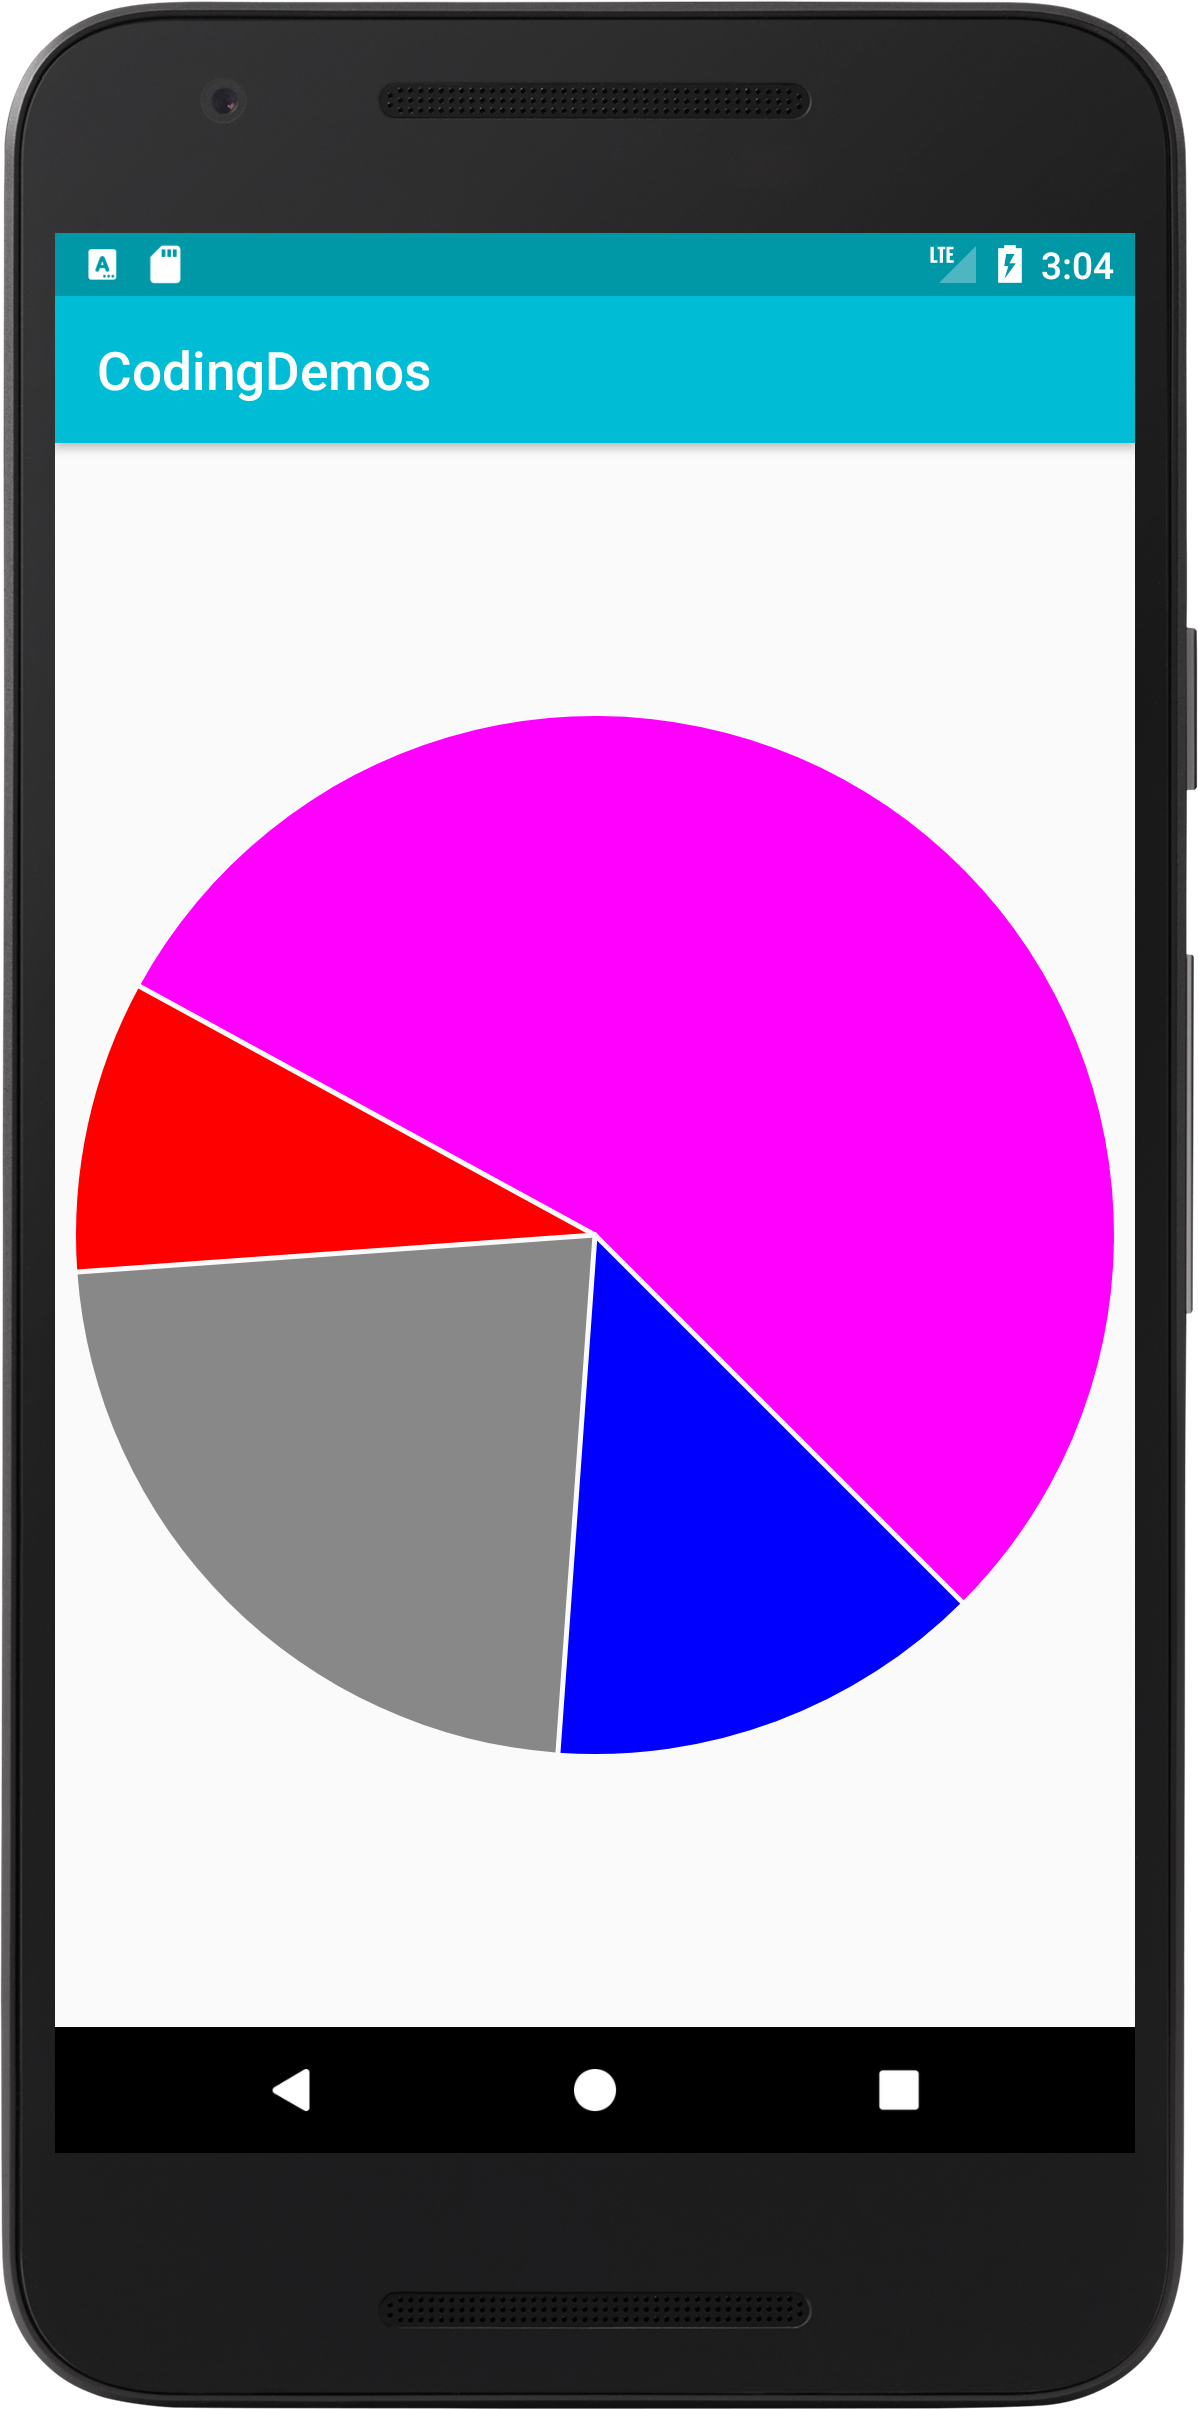
Pie chart in Android app. (Large preview)
How to show label inside Android pie chart
14- Modify pieData code to include label along with size and color of pie chart like this.
pieData.add(new SliceValue(15, Color.BLUE).setLabel("Q1: $10"));
pieData.add(new SliceValue(25, Color.GRAY).setLabel("Q2: $4"));
pieData.add(new SliceValue(10, Color.RED).setLabel("Q3: $18"));
pieData.add(new SliceValue(60, Color.MAGENTA).setLabel("Q4: $28"));
15- Make sure to include the following code, otherwise the label will not appear inside pie chart graph.
pieChartData.setHasLabels(true);
16- Now build and run the app to see pie chart graph.

Android pie chart with label. (Large preview)
How to increase label text size of pie chart graph
17- You can increase the label text size of the pie chart by modifying the code in step 15 to the following code.
pieChartData.setHasLabels(true).setValueLabelTextSize(14);
18- Build and run the app to see the result.
Increased label text size in pie chart graph. (Large preview)
Adding label in the center of pie chart graph in Android
19- You can further customize the appearance of Android pie chart by adding a label in the center of the graph like this.
pieChartData.setHasCenterCircle(true).setCenterText1("Sales in million");
20- Build and run the app to see the output.
Showing pie chart with label in center. (Large preview)
21- You can also adjust the size as well as the color of the center text like this.
pieChartData.setHasCenterCircle(true).setCenterText1("Sales in million").setCenterText1FontSize(20).setCenterText1Color(Color.parseColor("#0097A7"));
22- Now build and run the app.

Customized the appearance of pie chart graph. (Large preview)
23- Here is the full code for activity_main.xml file.
< ?xml version="1.0" encoding="utf-8"?>
< LinearLayout xmlns:android="http://schemas.android.com/apk/res/android"
  xmlns:app="http://schemas.android.com/apk/res-auto"
  xmlns:tools="http://schemas.android.com/tools"
  android:layout_width="match_parent"
  android:layout_height="match_parent"
  android:orientation="vertical"
  tools:context="com.codingdemos.codingdemos.MainActivity">

  < lecho.lib.hellocharts.view.PieChartView
    android:id="@+id/chart"
    android:layout_width="match_parent"
    android:layout_height="match_parent" />

< /LinearLayout>
24- Here is the full code for MainActivity.java file.
package com.codingdemos.codingdemos;

import android.graphics.Color;
import android.os.Bundle;
import android.support.v7.app.AppCompatActivity;

import java.util.ArrayList;
import java.util.List;

import lecho.lib.hellocharts.model.PieChartData;
import lecho.lib.hellocharts.model.SliceValue;
import lecho.lib.hellocharts.view.PieChartView;

public class MainActivity extends AppCompatActivity {

    PieChartView pieChartView;

    @Override
    protected void onCreate(Bundle savedInstanceState) {
        super.onCreate(savedInstanceState);
        setContentView(R.layout.activity_main);

        pieChartView = findViewById(R.id.chart);

        List<SliceValue> pieData = new ArrayList<>();
        pieData.add(new SliceValue(15, Color.BLUE).setLabel("Q1: $10"));
        pieData.add(new SliceValue(25, Color.GRAY).setLabel("Q2: $4"));
        pieData.add(new SliceValue(10, Color.RED).setLabel("Q3: $18"));
        pieData.add(new SliceValue(60, Color.MAGENTA).setLabel("Q4: $28"));

        PieChartData pieChartData = new PieChartData(pieData);
        pieChartData.setHasLabels(true).setValueLabelTextSize(14);
        pieChartData.setHasCenterCircle(true).setCenterText1("Sales in million").setCenterText1FontSize(20).setCenterText1Color(Color.parseColor("#0097A7"));
        pieChartView.setPieChartData(pieChartData);
    }

}
25- I hope you find this tutorial helpful and if you have any question please post them in the comment below.
I am trying to add the values of piechart from two different functions and now what happens is the new value replaces the whole pie chart what should i do
Hi, how are you creating those values for the piechart?
package com.example.simantstha.expensetracker;
import android.content.Intent;
import android.graphics.Color;
import android.support.v7.app.AlertDialog;
import android.support.v7.app.AppCompatActivity;
import android.os.Bundle;
import android.view.View;
import android.widget.Button;
import android.widget.EditText;
import android.widget.ImageButton;
import android.widget.TextView;
import android.widget.Toast;
import java.util.*;
import lecho.lib.hellocharts.model.PieChartData;
import lecho.lib.hellocharts.model.SliceValue;
import lecho.lib.hellocharts.view.PieChartView;
public class Main2Activity extends AppCompatActivity {
final ArrayList expTit = new ArrayList();
final ArrayList expAmt = new ArrayList();
PieChartView pieChartView;
final List pieData = new ArrayList();
public void popbox(View view)
{
ImageButton plus = (ImageButton) findViewById(R.id.plus);
plus.setOnClickListener(new View.OnClickListener() {
@Override
public void onClick(View view) {
AlertDialog.Builder mBuilder = new AlertDialog.Builder(Main2Activity.this);
View mView = getLayoutInflater().inflate(R.layout.popup,null);
final EditText title = (EditText) mView.findViewById(R.id.title);
final EditText amount = (EditText) mView.findViewById(R.id.bgamount);
Button expAdd = (Button) mView.findViewById(R.id.expAdd);
expAdd.setOnClickListener(new View.OnClickListener() {
@Override
public void onClick(View view) {
if(title.getText().toString().isEmpty())
{
Toast.makeText(Main2Activity.this, “Empty Feild”, Toast.LENGTH_SHORT).show();
}
else
{
Toast.makeText(Main2Activity.this, “Congratulations”, Toast.LENGTH_SHORT).show();
expTit.add(title.getText().toString());
expAmt.add(Integer.parseInt(amount.getText().toString()));
int sum=0;
for (Integer number : expAmt) {
sum+=number;
}
TextView t1=(TextView)findViewById(R.id.exp);
pieData.add(new SliceValue(sum, Color.RED).setLabel(“B”));
t1.setText(“Expense: “+Integer.toString(sum));
}
}
});
mBuilder.setView(mView);
AlertDialog dialog = mBuilder.create();
dialog.show();
}
});
}
public void popbox2(View view)
{
Button budget = (Button) findViewById(R.id.budget);
budget.setOnClickListener(new View.OnClickListener() {
@Override
public void onClick(View view) {
AlertDialog.Builder mBuilder = new AlertDialog.Builder(Main2Activity.this);
View mView = getLayoutInflater().inflate(R.layout.popup2,null);
final EditText bgamount = (EditText) mView.findViewById(R.id.bgamount);
Button budAdd = (Button) mView.findViewById(R.id.budAdd);
budAdd.setOnClickListener(new View.OnClickListener() {
@Override
public void onClick(View view) {
if(bgamount.getText().toString().isEmpty())
{
Toast.makeText(Main2Activity.this, “Empty Feild”, Toast.LENGTH_SHORT).show();
}
else
{
Toast.makeText(Main2Activity.this, “Congratulations”, Toast.LENGTH_SHORT).show();
TextView t=(TextView)findViewById(R.id.bug);
t.setText(“Budget: “+bgamount.getText().toString());
pieData.add(new SliceValue(Integer.parseInt(bgamount.getText().toString()), Color.BLUE).setLabel(“c”));
}
}
});
mBuilder.setView(mView);
AlertDialog dialog = mBuilder.create();
dialog.show();
}
});
}
public void actFunc(View view)
{
Intent intent1 = new Intent(Main2Activity.this,Main3Activity.class);
intent1.putExtra(“expTit”,expTit);
Intent intent2 = new Intent(Main2Activity.this,Main3Activity.class);
intent2.putExtra(“expAmt”,expAmt);
startActivity(intent1);
startActivity(intent2);
}
@Override
protected void onCreate(Bundle savedInstanceState) {
super.onCreate(savedInstanceState);
setContentView(R.layout.activity_main2);
pieChartView = findViewById(R.id.chart);
PieChartData pieChartData = new PieChartData(pieData);
pieChartData.setHasLabels(true).setValueLabelTextSize(20);
pieChartData.setHasCenterCircle(true).setCenterText1(“Expense Pie”).setCenterText1FontSize(20).setCenterText1Color(Color.parseColor(“#0097A7”));
pieChartView.setPieChartData(pieChartData);
}
}
Its the code if you could look every time different function runs it takes whole pie
Put this line on Build.gradle, without it the app will crash
compile ‘com.android.support:design:27.1.1’
How can I remove lable background color ?
Hi, just remove the color from SliceValue like this:
//Before
pieData.add(new SliceValue(15, Color.BLUE));
//After
pieData.add(new SliceValue(15));
Hi, How can i reduces circle slice width
changing the inner circle diameter will change the slice width. use setCenterCircleScale(float);
Hello Brother
please provide the code for PieChartView, PiesData And SliceValue classes
disable pie rotation?
Hello Brother codedmin,
Thanks a lot for sharing such nice library , thanks from bottom of my heart!
hi. how can i change this List pieData = new ArrayList(); to be the month of the year using the system calender?.
The label not display in pie chart , how to resolve?
Hi,
What do you do if you turn your phone into landscape mode and want to save the state of the pie chart. (Like save the pie chart from one rotation to the other)
How to show label outside pie chart?
How i could change the value from databases such as mysql?
Hi,
Why Graph is not working with