
Last Updated on July 16, 2018
Hi and welcome to another tutorial from Codingdemos, in this tutorial you will learn how to draw line chart in android. You will be building an app that will will show a monthly sales of a company for the year inside a line chart.
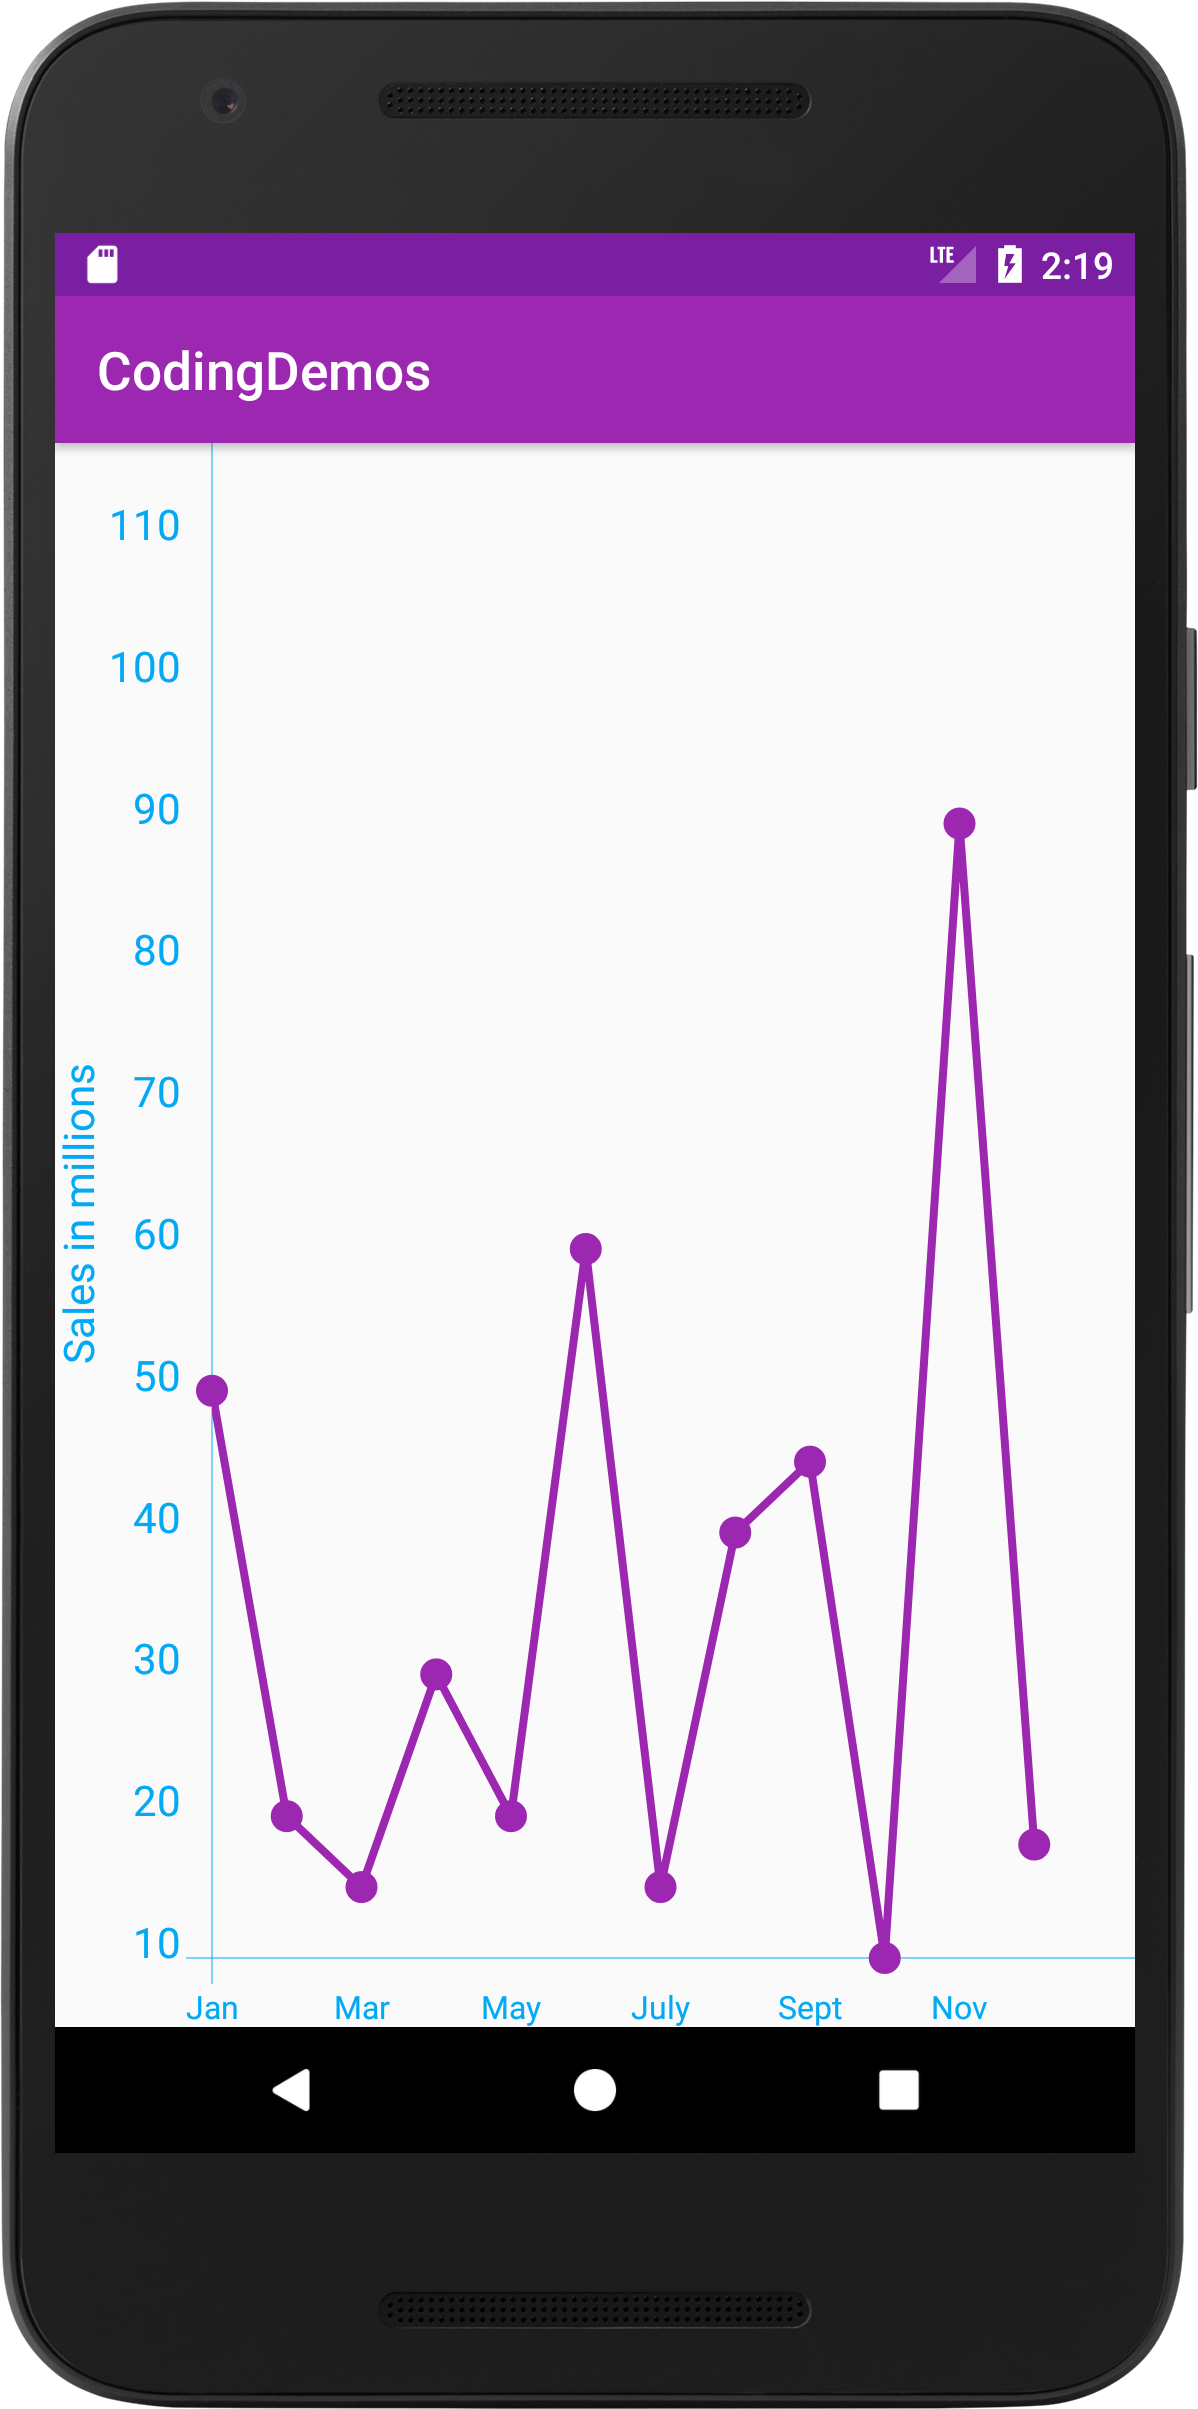
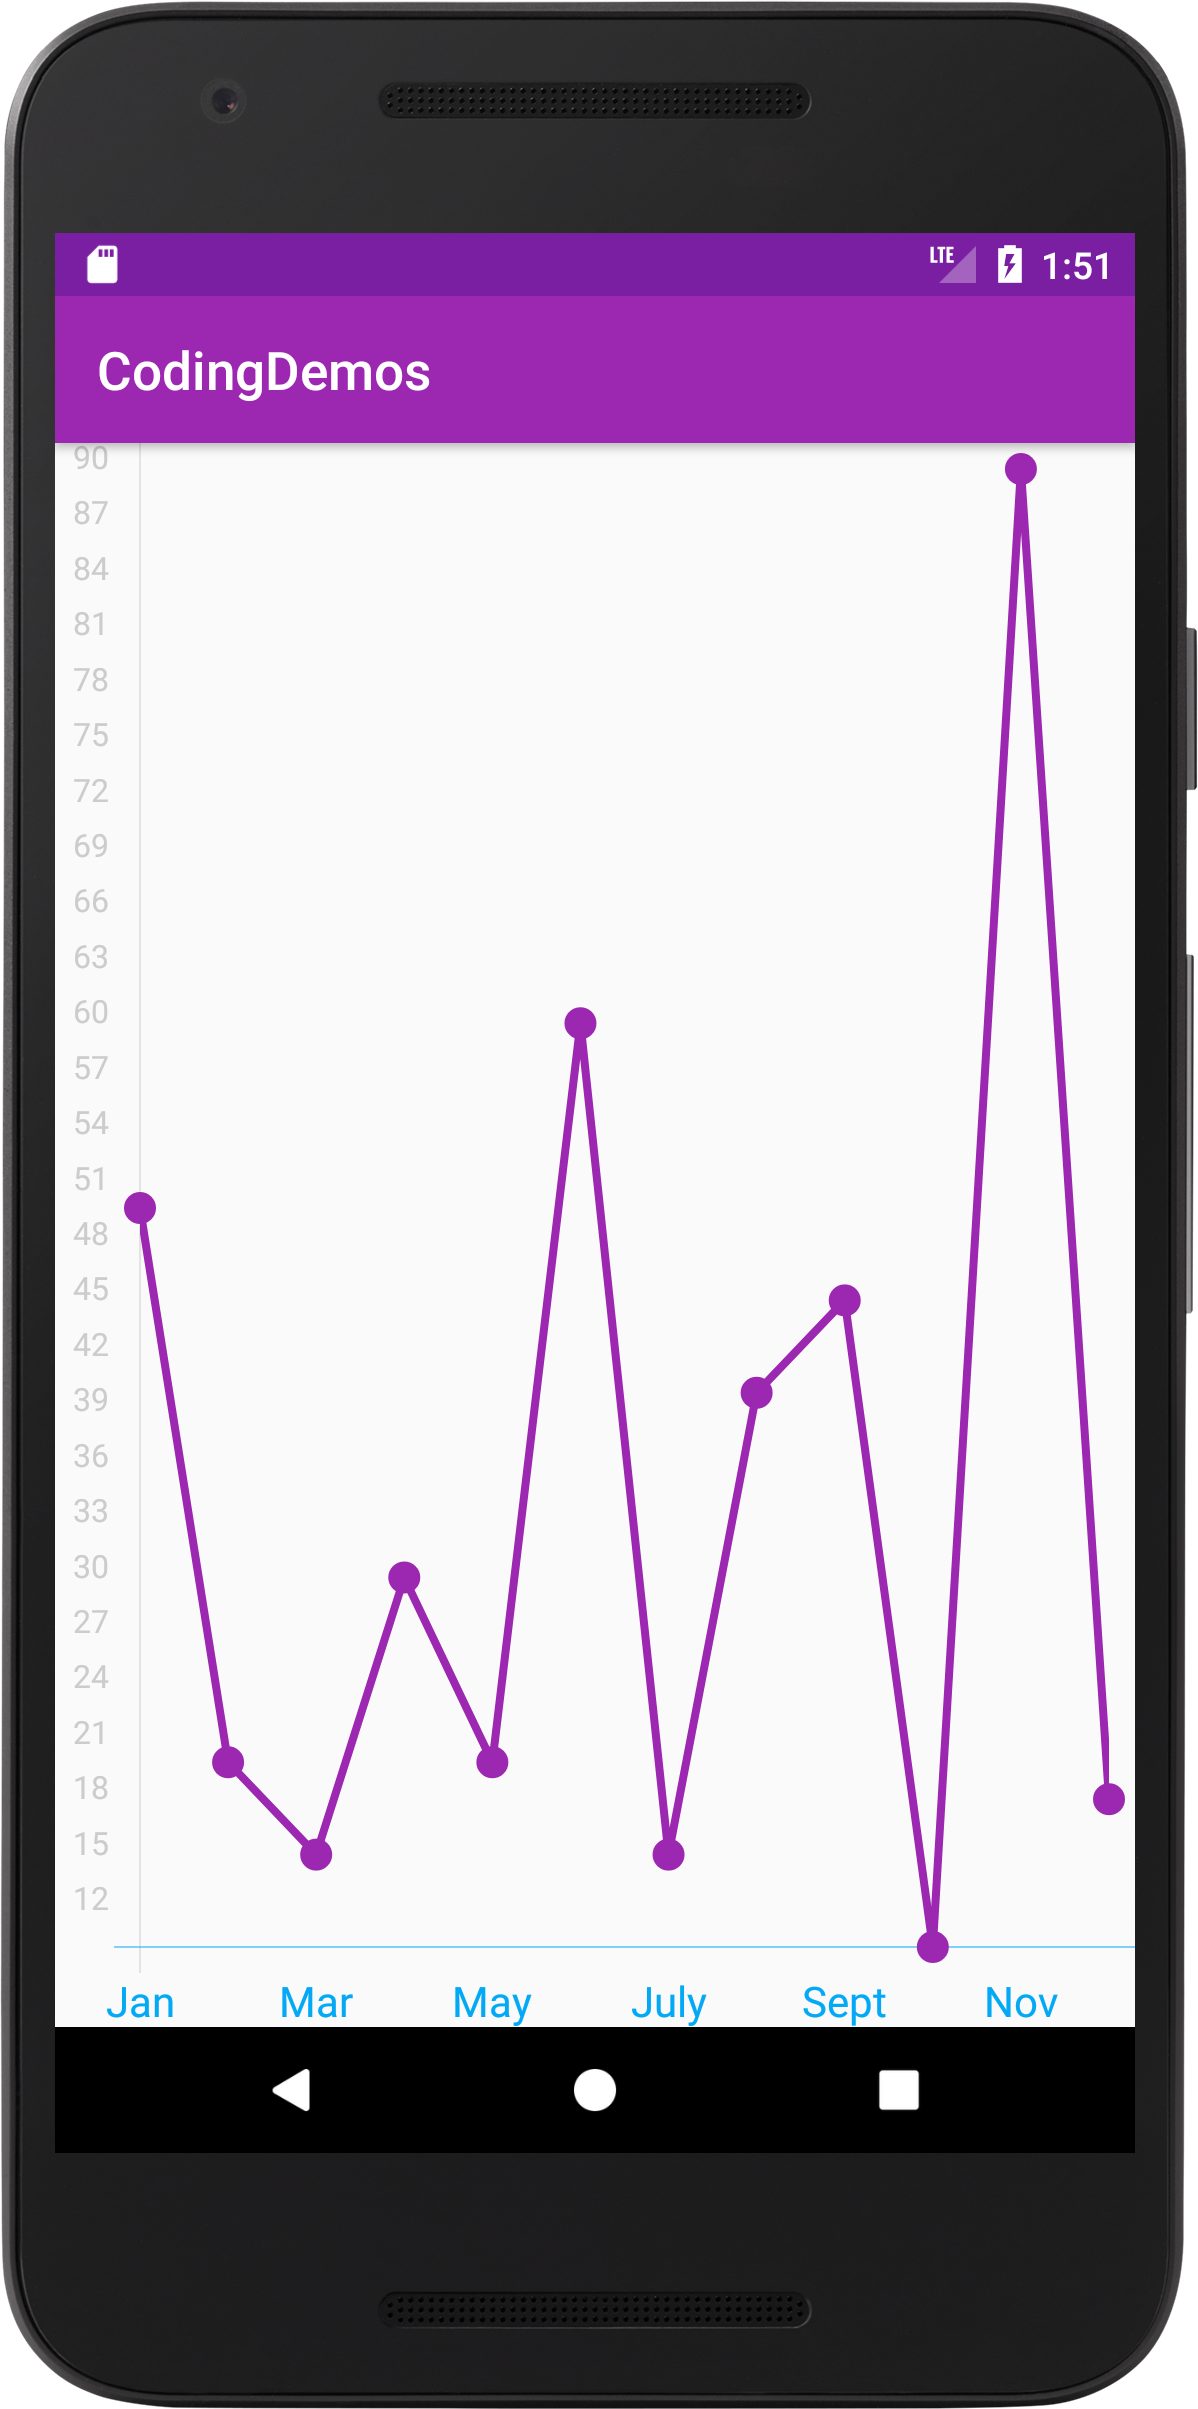
By the end of this tutorial, you will have an app that looks like this. (Large preview)
In this tutorial you will be using a 3rd party library called Hellocharts-Android, this library will help you build Android line chart.
In this tutorial we will be using the following:
– Android studio version 3.0.1
– Android emulator Nexus 5X with API 26
– Minimum SDK API 16
1- Open up Android Studio and open any project that you have in your computer.

Create new Android Studio project or open existing project. (Large preview)
2- Open up build.gradle (module:app) and add the library in the dependencies.
implementation 'com.github.lecho:hellocharts-library:1.5.8@aar'
3- Next you need to open up build.gradle (Project) and add Jcenter because this library is available through it.
allprojects {
    repositories {
        google()
        jcenter()
    }
}
4- Now sync your project by clicking on Sync Now.

Android studio sync project. (Large preview)
5- Open up colors.xml file to change the colors of the main app.
< color name="colorPrimary">#9C27B0< /color>
< color name="colorPrimaryDark">#7B1FA2< /color>
< color name="colorAccent">#03A9F4< /color>
6- Build and run the app to see the new colors.

New colors for the app. (Large preview)
7- Open up activity_main.xml and add the following code.
< lecho.lib.hellocharts.view.LineChartView
    android:id="@+id/chart"
    android:layout_width="match_parent"
    android:layout_height="match_parent" />
This is the code which is use to draw line chart.
8- Open up MainActivity.java to reference LineChartView.
LineChartView lineChartView = findViewById(R.id.chart);
9- Next you need to initialize the actual data which will appear later inside Android line chart. First declare and initialize the data for Axis.
String[] axisData = {"Jan", "Feb", "Mar", "Apr", "May", "June", "July", "Aug", "Sept",
            "Oct", "Nov", "Dec"};
10- Now you need to declare and initialize the data for Y-Axis.
int[] yAxisData = {50, 20, 15, 30, 20, 60, 15, 40, 45, 10, 90, 18};
11- Next declare 2 types of List like the following.
List<PointValue> yAxisValues = new ArrayList<PointValue>();
List<AxisValue> axisValues = new ArrayList<AxisValue>();
These lists will be used to hold the data for Axis and Y-Axis.
12- Declare and initialize the line which appears inside graph chart, this line will hold the values of Y-Axis.
Line line = new Line(yAxisValues);
13- Next you need to add Axis and Y-Axis data inside yAxisValues and axisValues lists.
        for(int i = 0; i < axisData.length; i++){
            axisValues.add(i, new AxisValue(i).setLabel(axisData[i]));
        }

        for (int i = 0; i < yAxisData.length; i++){
            yAxisValues.add(new PointValue(i, yAxisData[i]));
        }
14- Declare a list of a type Line.
List<Line> lines = new ArrayList<Line>();
lines.add(line);
This list will hold the line of the graph chart.
15- Now you can add the graph line to the overall data chart.
LineChartData data = new LineChartData();
data.setLines(lines);
16- Now you need to add the following code to be able to see the Android line chart.
lineChartView.setLineChartData(data);
17- Build and run the app to see the output.
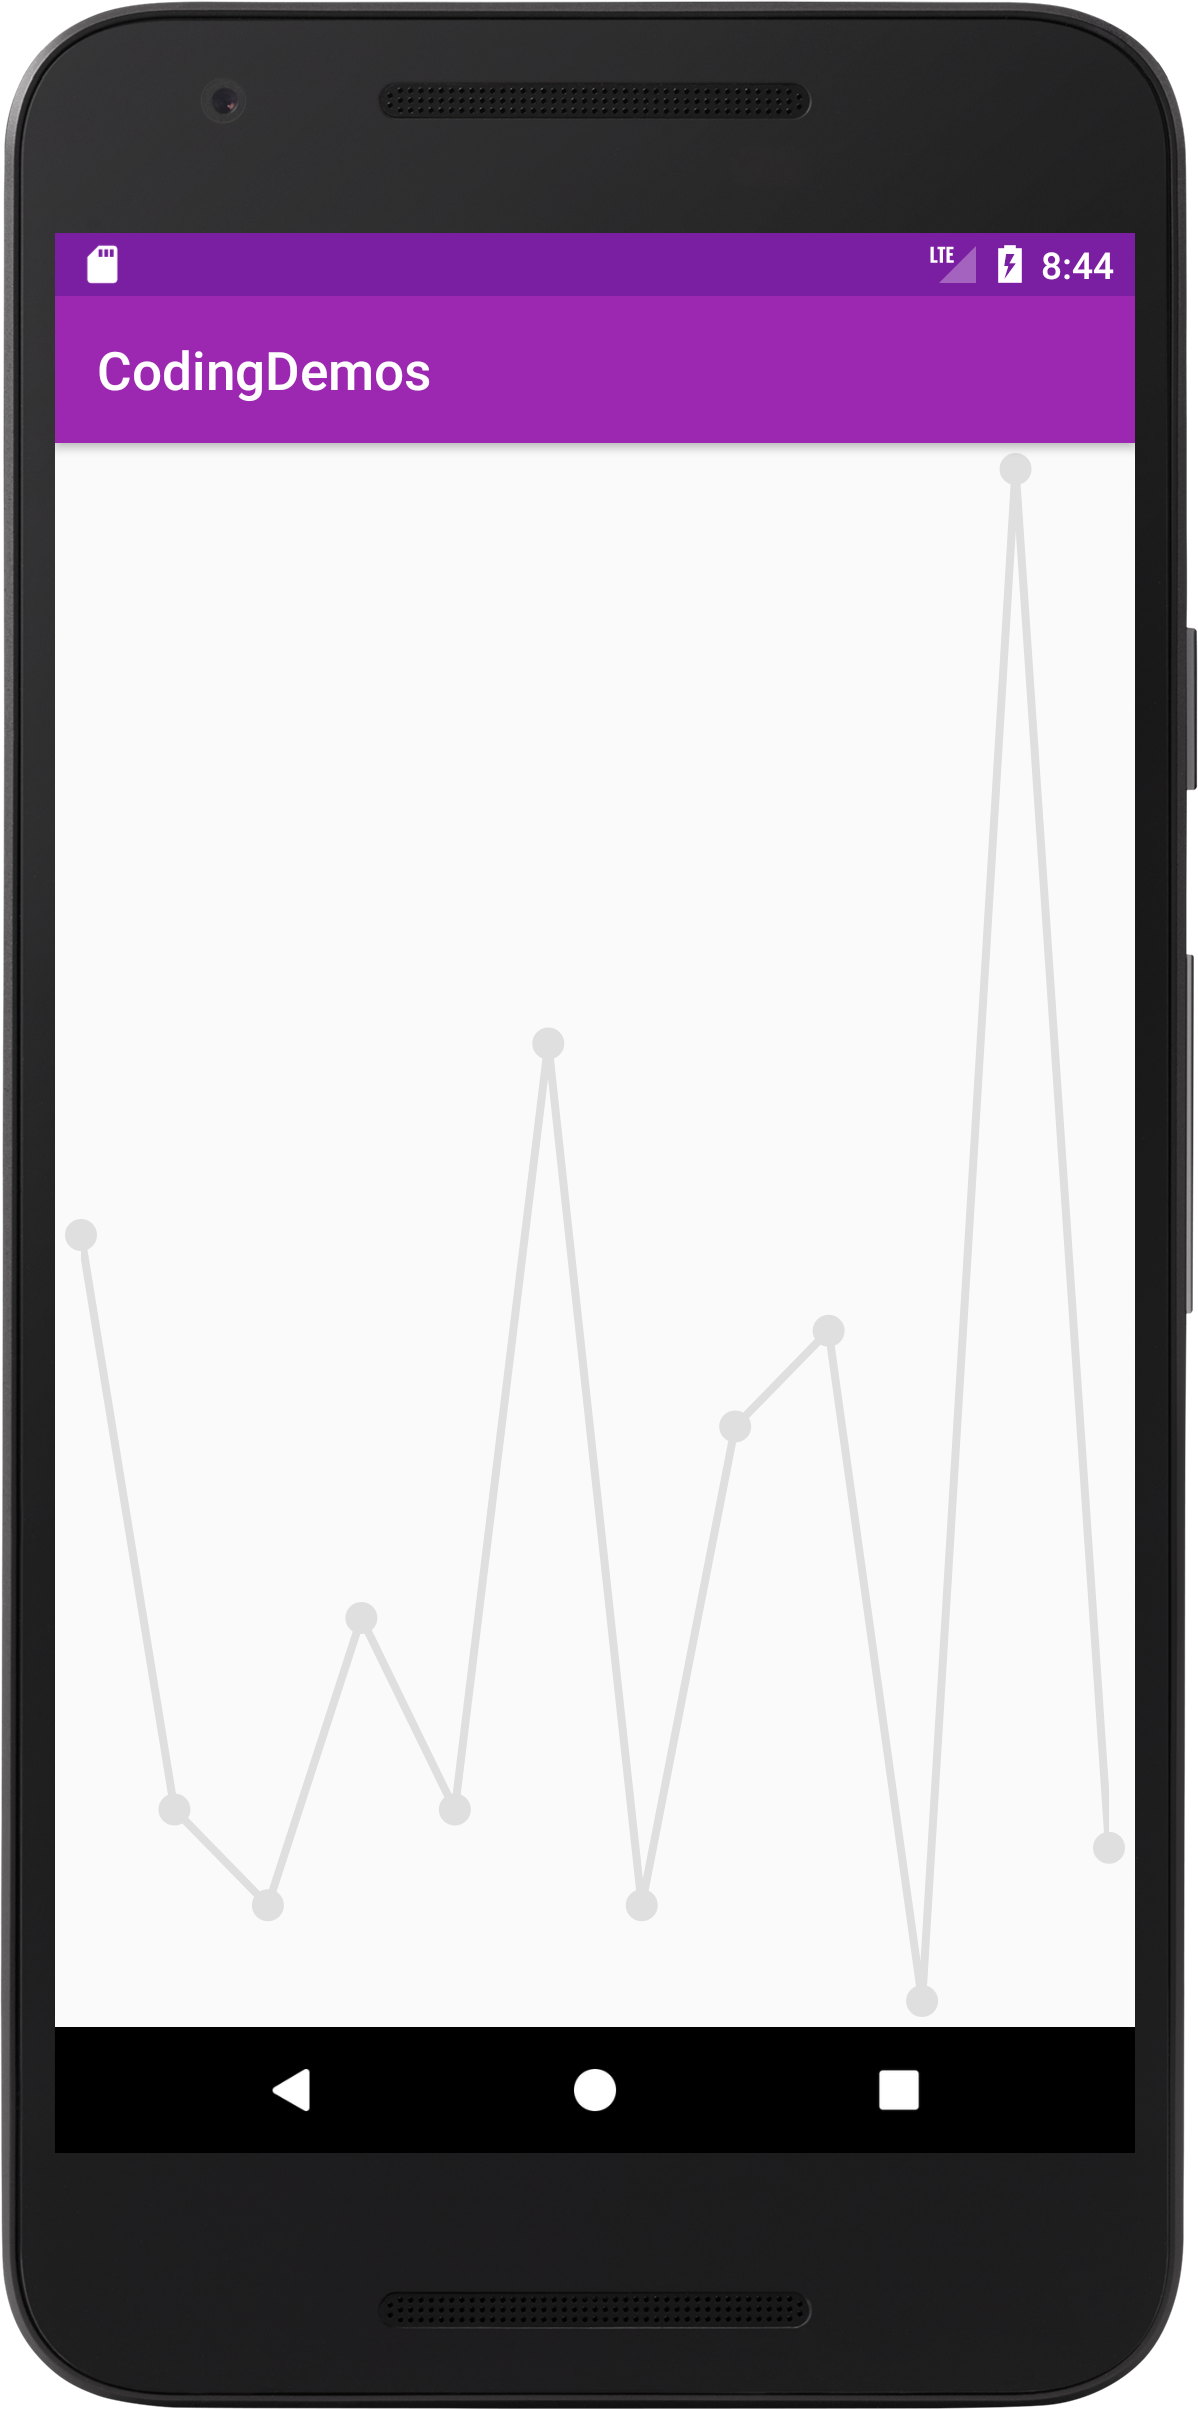
Line chart in android. (Large preview)
18- Now that you managed to draw the line chart, the only thing missing is the Axis and Y-Axis values.
19- Let’s first work on getting the Axis values to show up in the line chart graph.
Axis axis = new Axis();
axis.setValues(axisValues);
data.setAxisXBottom(axis);
Here you’ve declared Axis model, then you’ve initialize it with axisValues data and finally you set axis data to be positioned at the bottom.
20- Now build and run the app to see the result.

Android line chart graph with Axis data. (Large preview)
21- Don’t worry about the text size as we will fix that later. Now let’s work on Y-Axis values.
Axis yAxis = new Axis();
data.setAxisYLeft(yAxis);
22- Build and run the app to see the output.

Android line chart graph with Y-Axis data. (Large preview)
How to change the color of Android line chart
23- Let’s change the color of line chart to something nice 🙂 Modify Line declaration code that you did in step 12 to the following.
Line line = new Line(yAxisValues).setColor(Color.parseColor("#9C27B0"));
24- Build and run the app to see the changes.
New color for line chart. (Large preview)
How to increase the text size of Axis data
25- Let’s increase the text size of the Axis data to be able to see it clearly. You can do that by adding the following code.
axis.setTextSize(16);
26- Build and run the app to see the output.
Increased text size of Axis line chart. (Large preview)
How to change the text color of Axis data
27- You can change the text color to any color that you like that matches your app just by adding the following code.
axis.setTextColor(Color.parseColor("#03A9F4"));
28- Build and run the app to see how it looks like.
Changed text color of Axis line chart. (Large preview)
29- Change the text size and color for Y-Axis data by adding the following code.
yAxis.setTextColor(Color.parseColor("#03A9F4"));
yAxis.setTextSize(16);
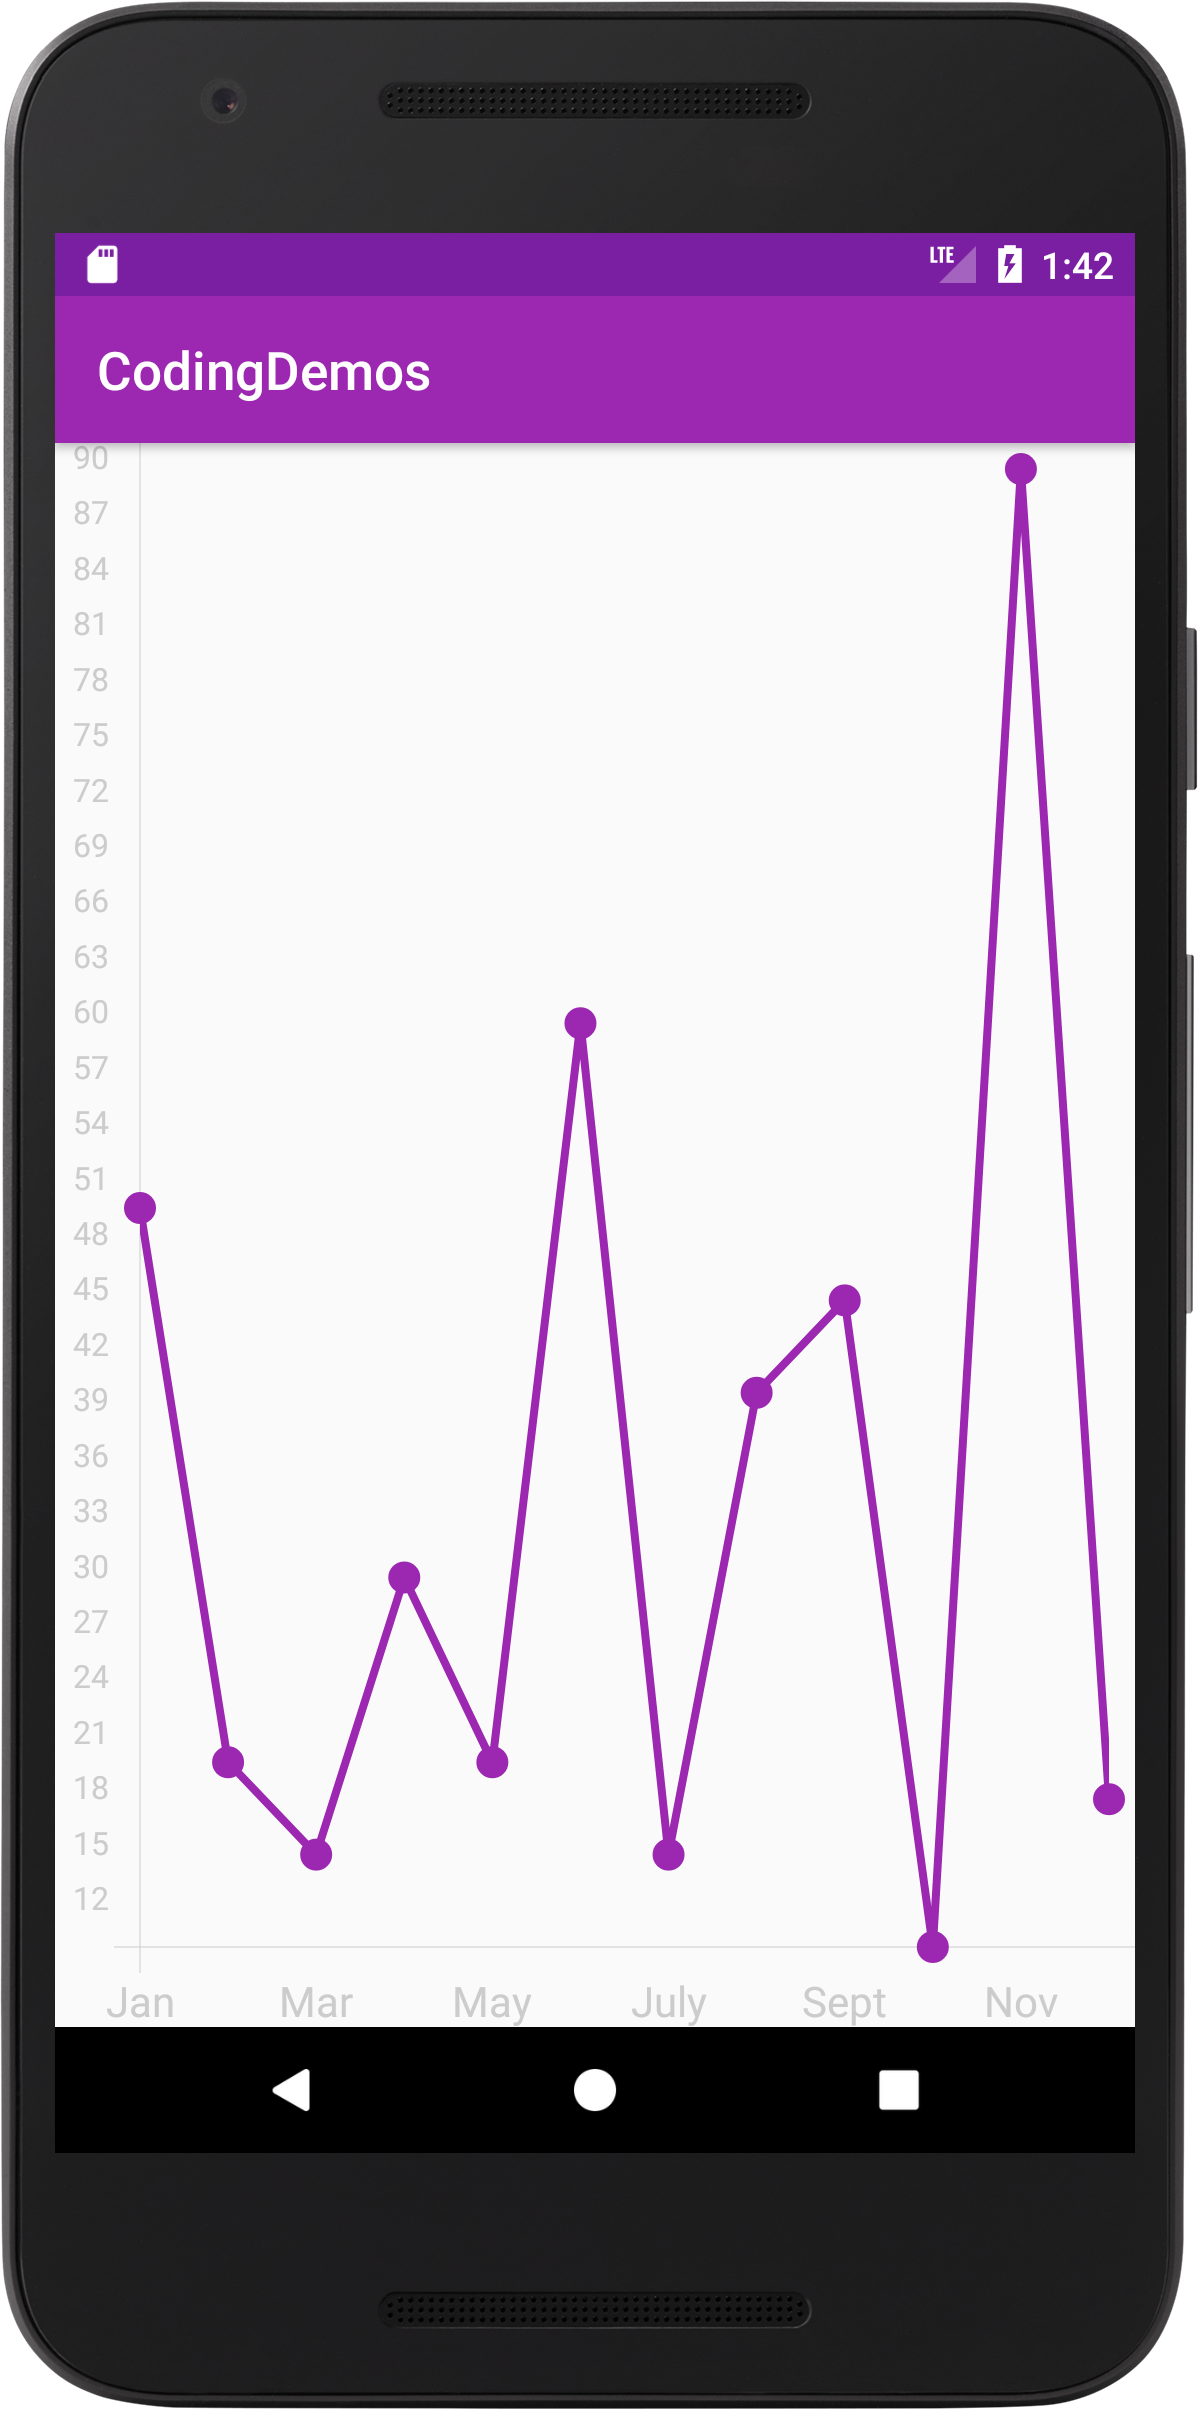
30- Now build and run the app to see the result.
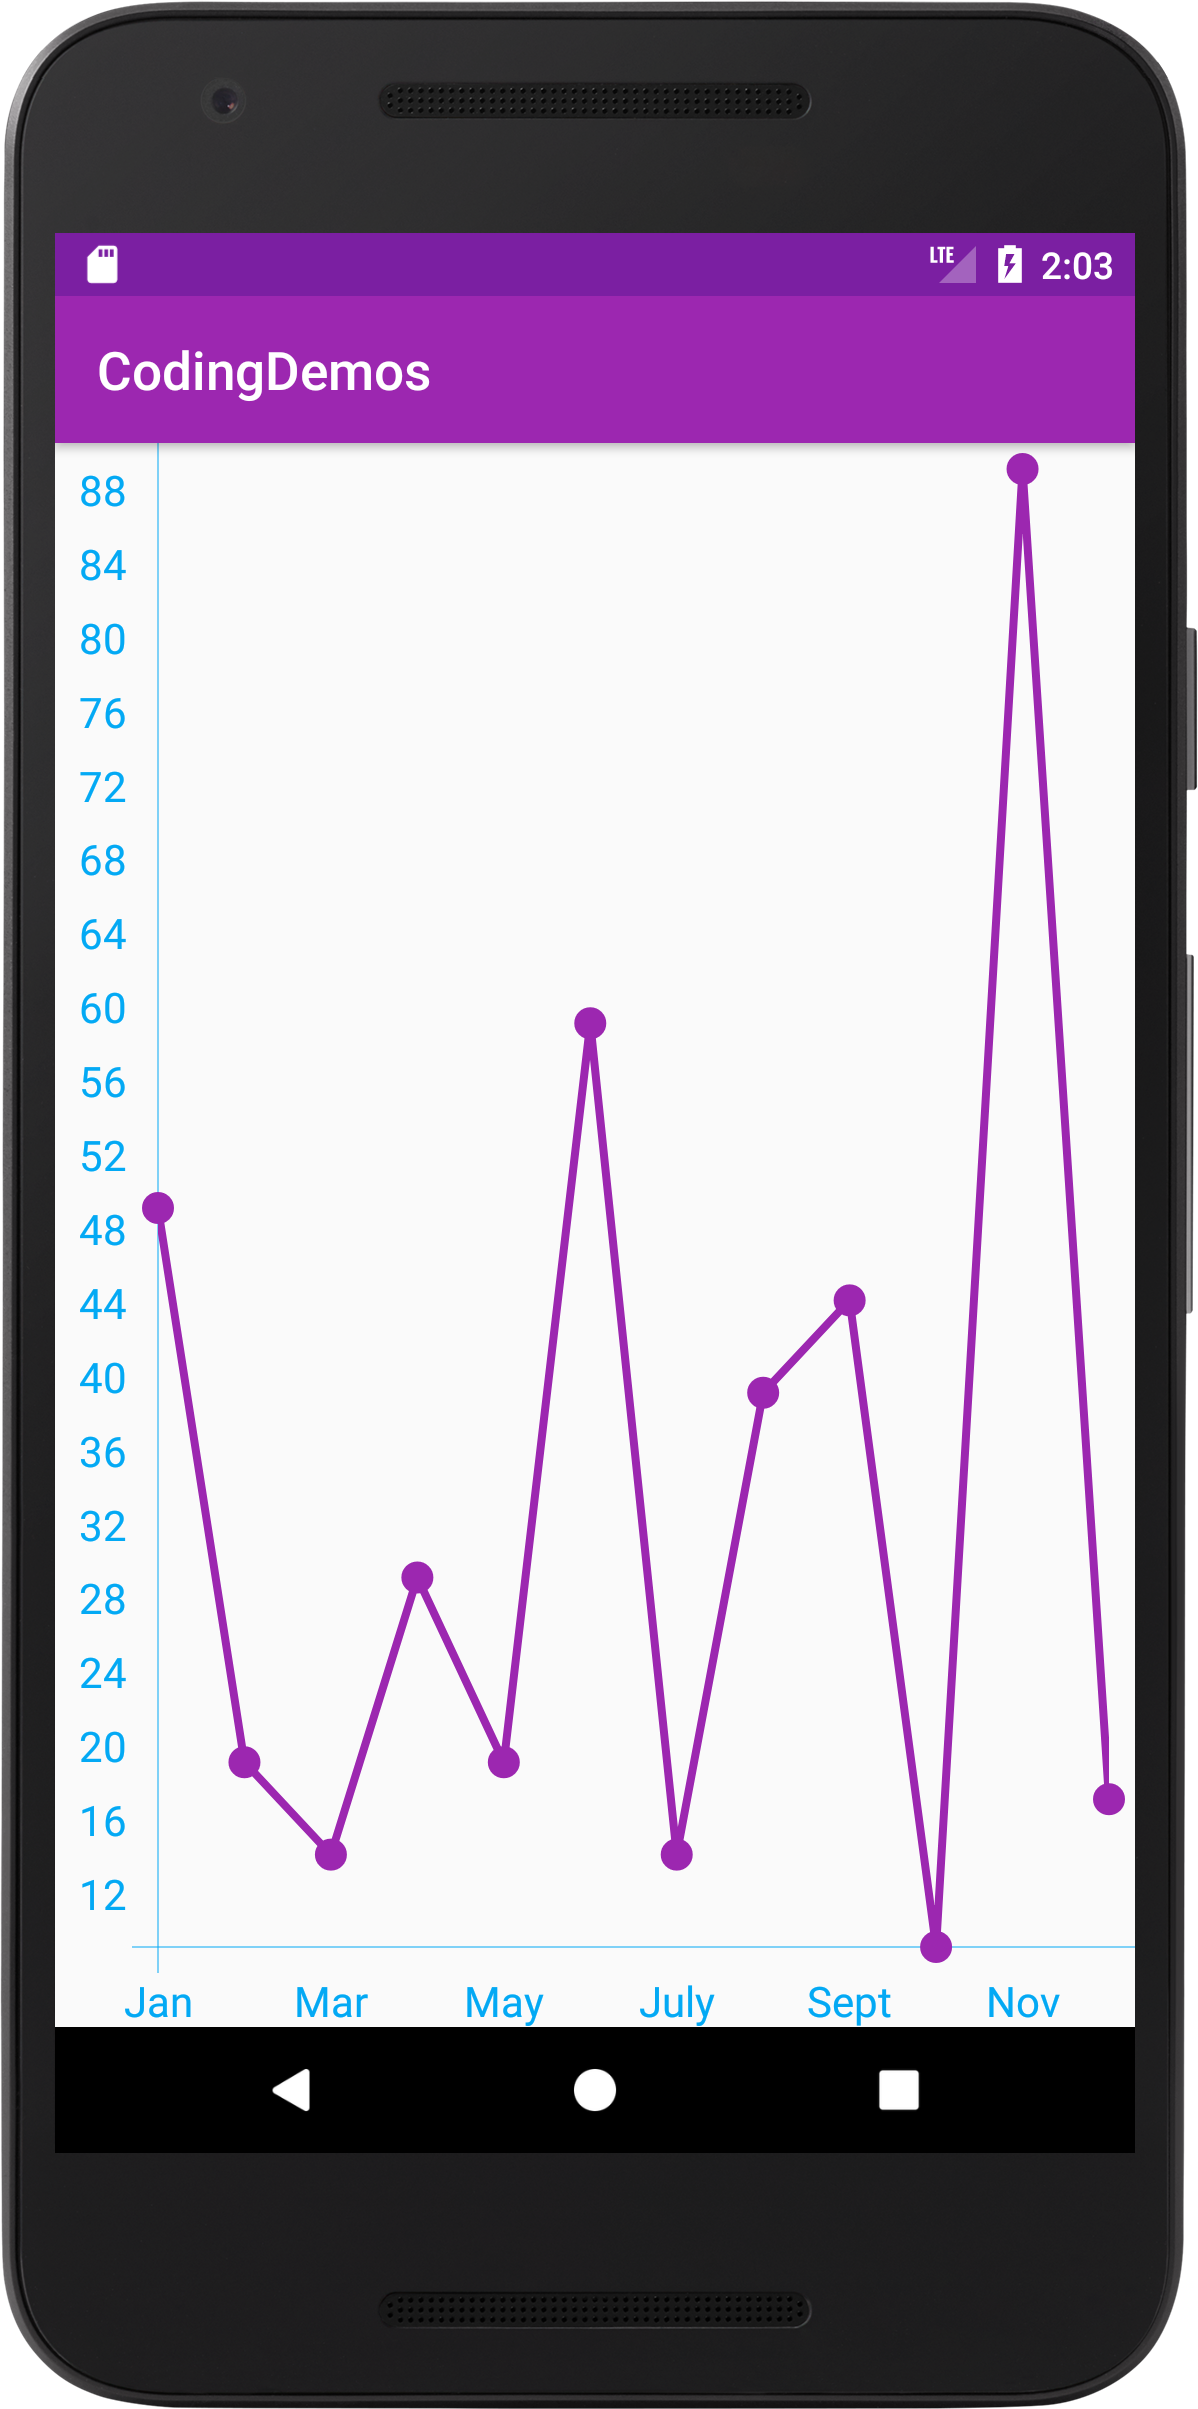
Changed text size & color of Y-Axis line chart. (Large preview)
How to add a label next to Y-Axis data
31- You can add a label that describe the type of data this line chart have by adding the following code.
yAxis.setName("Sales in millions");
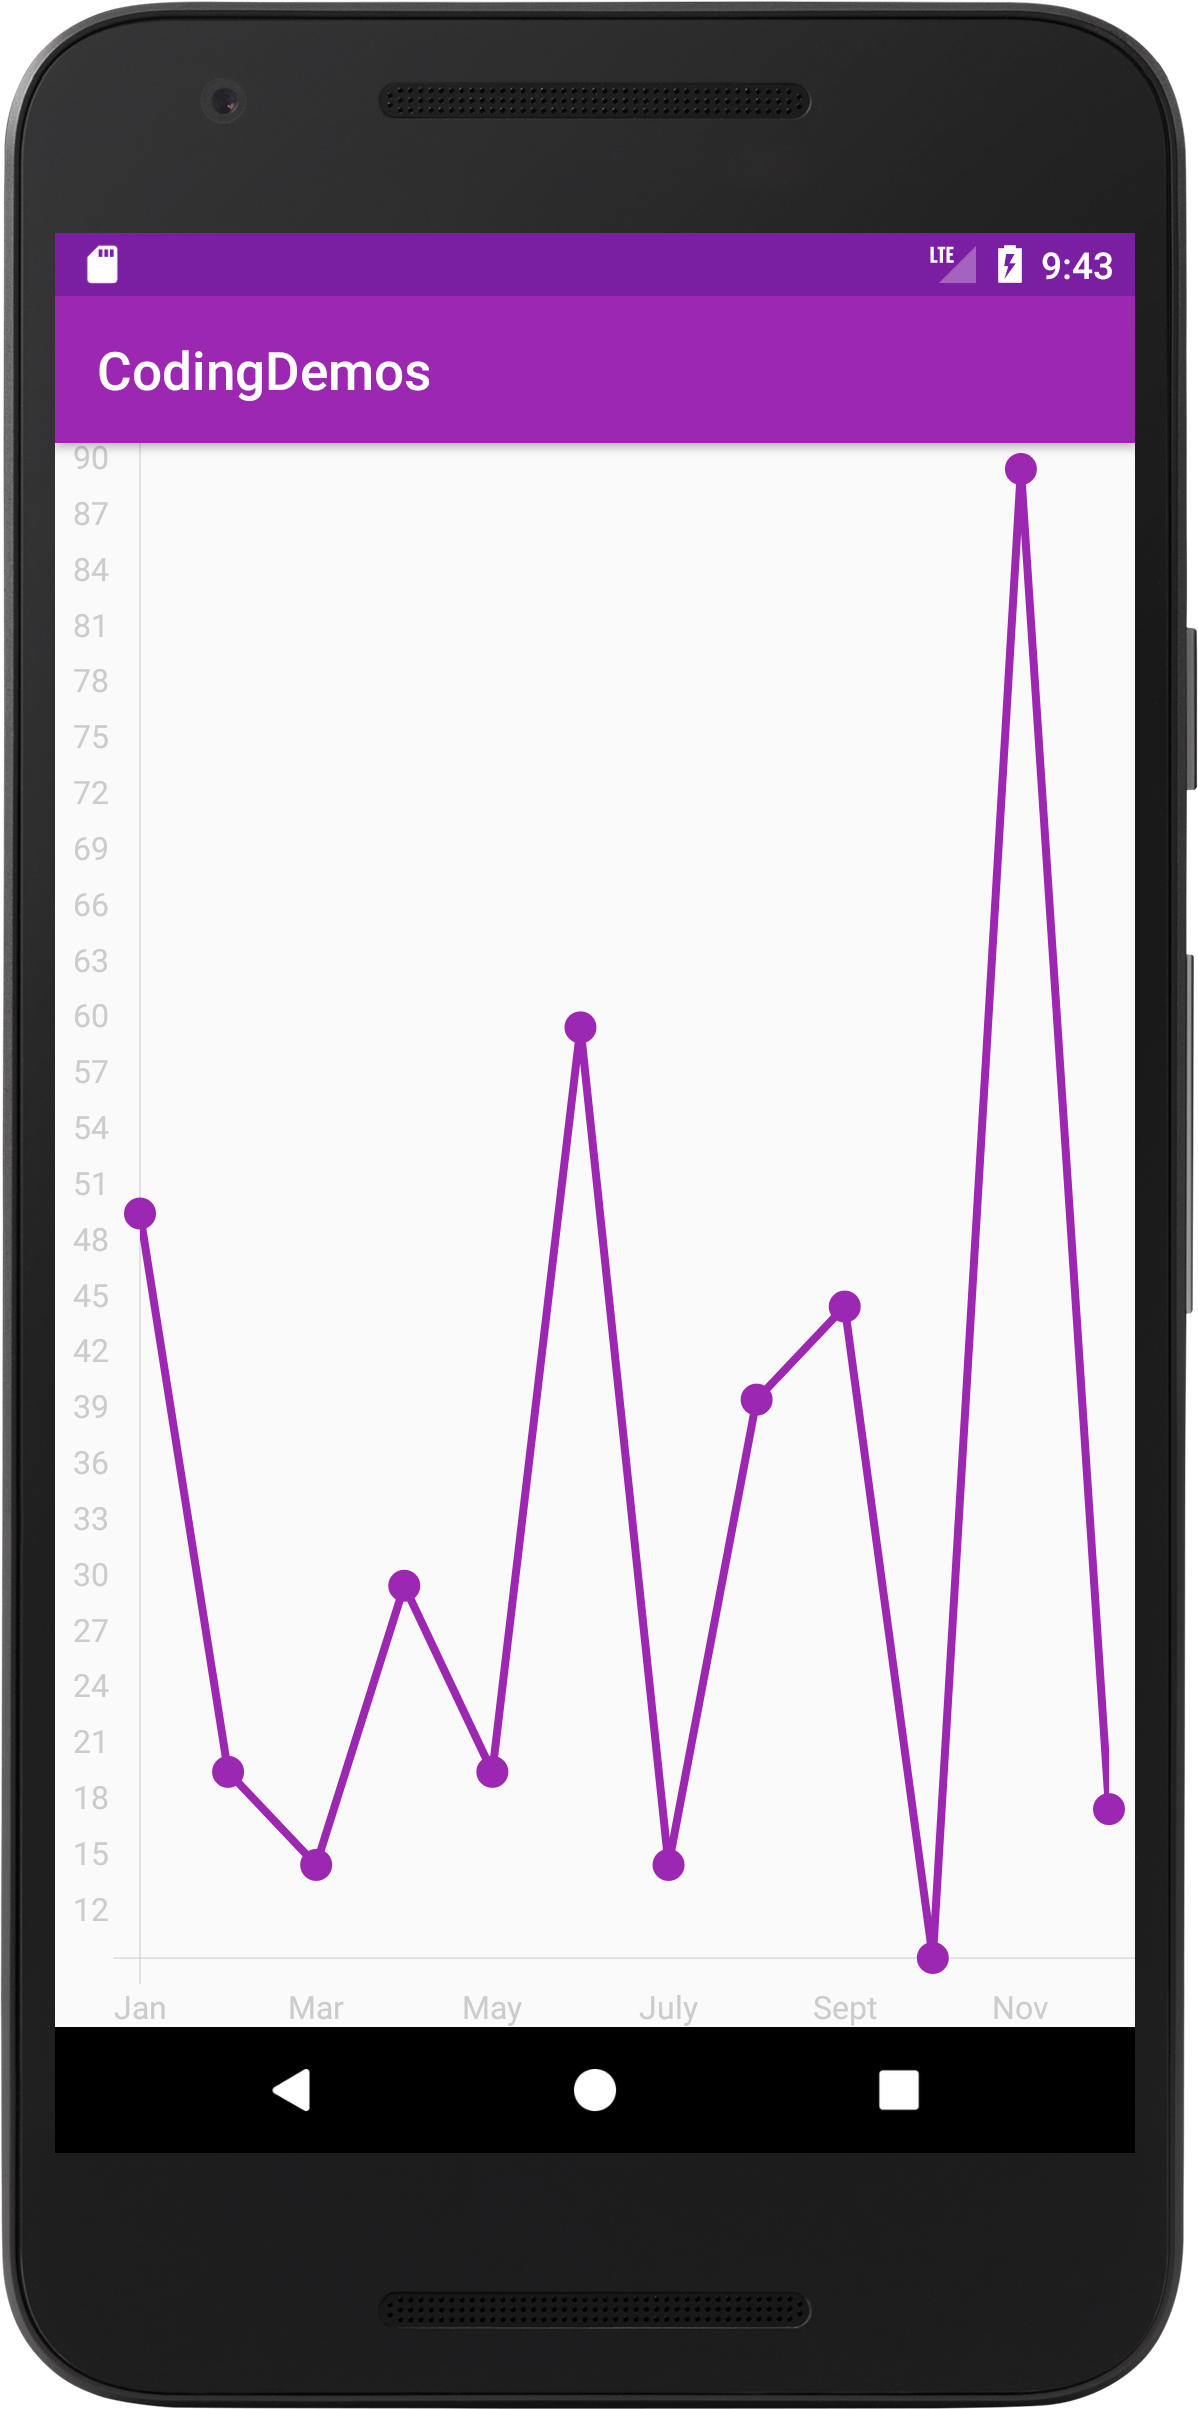
32- Build and run the app to see the output.
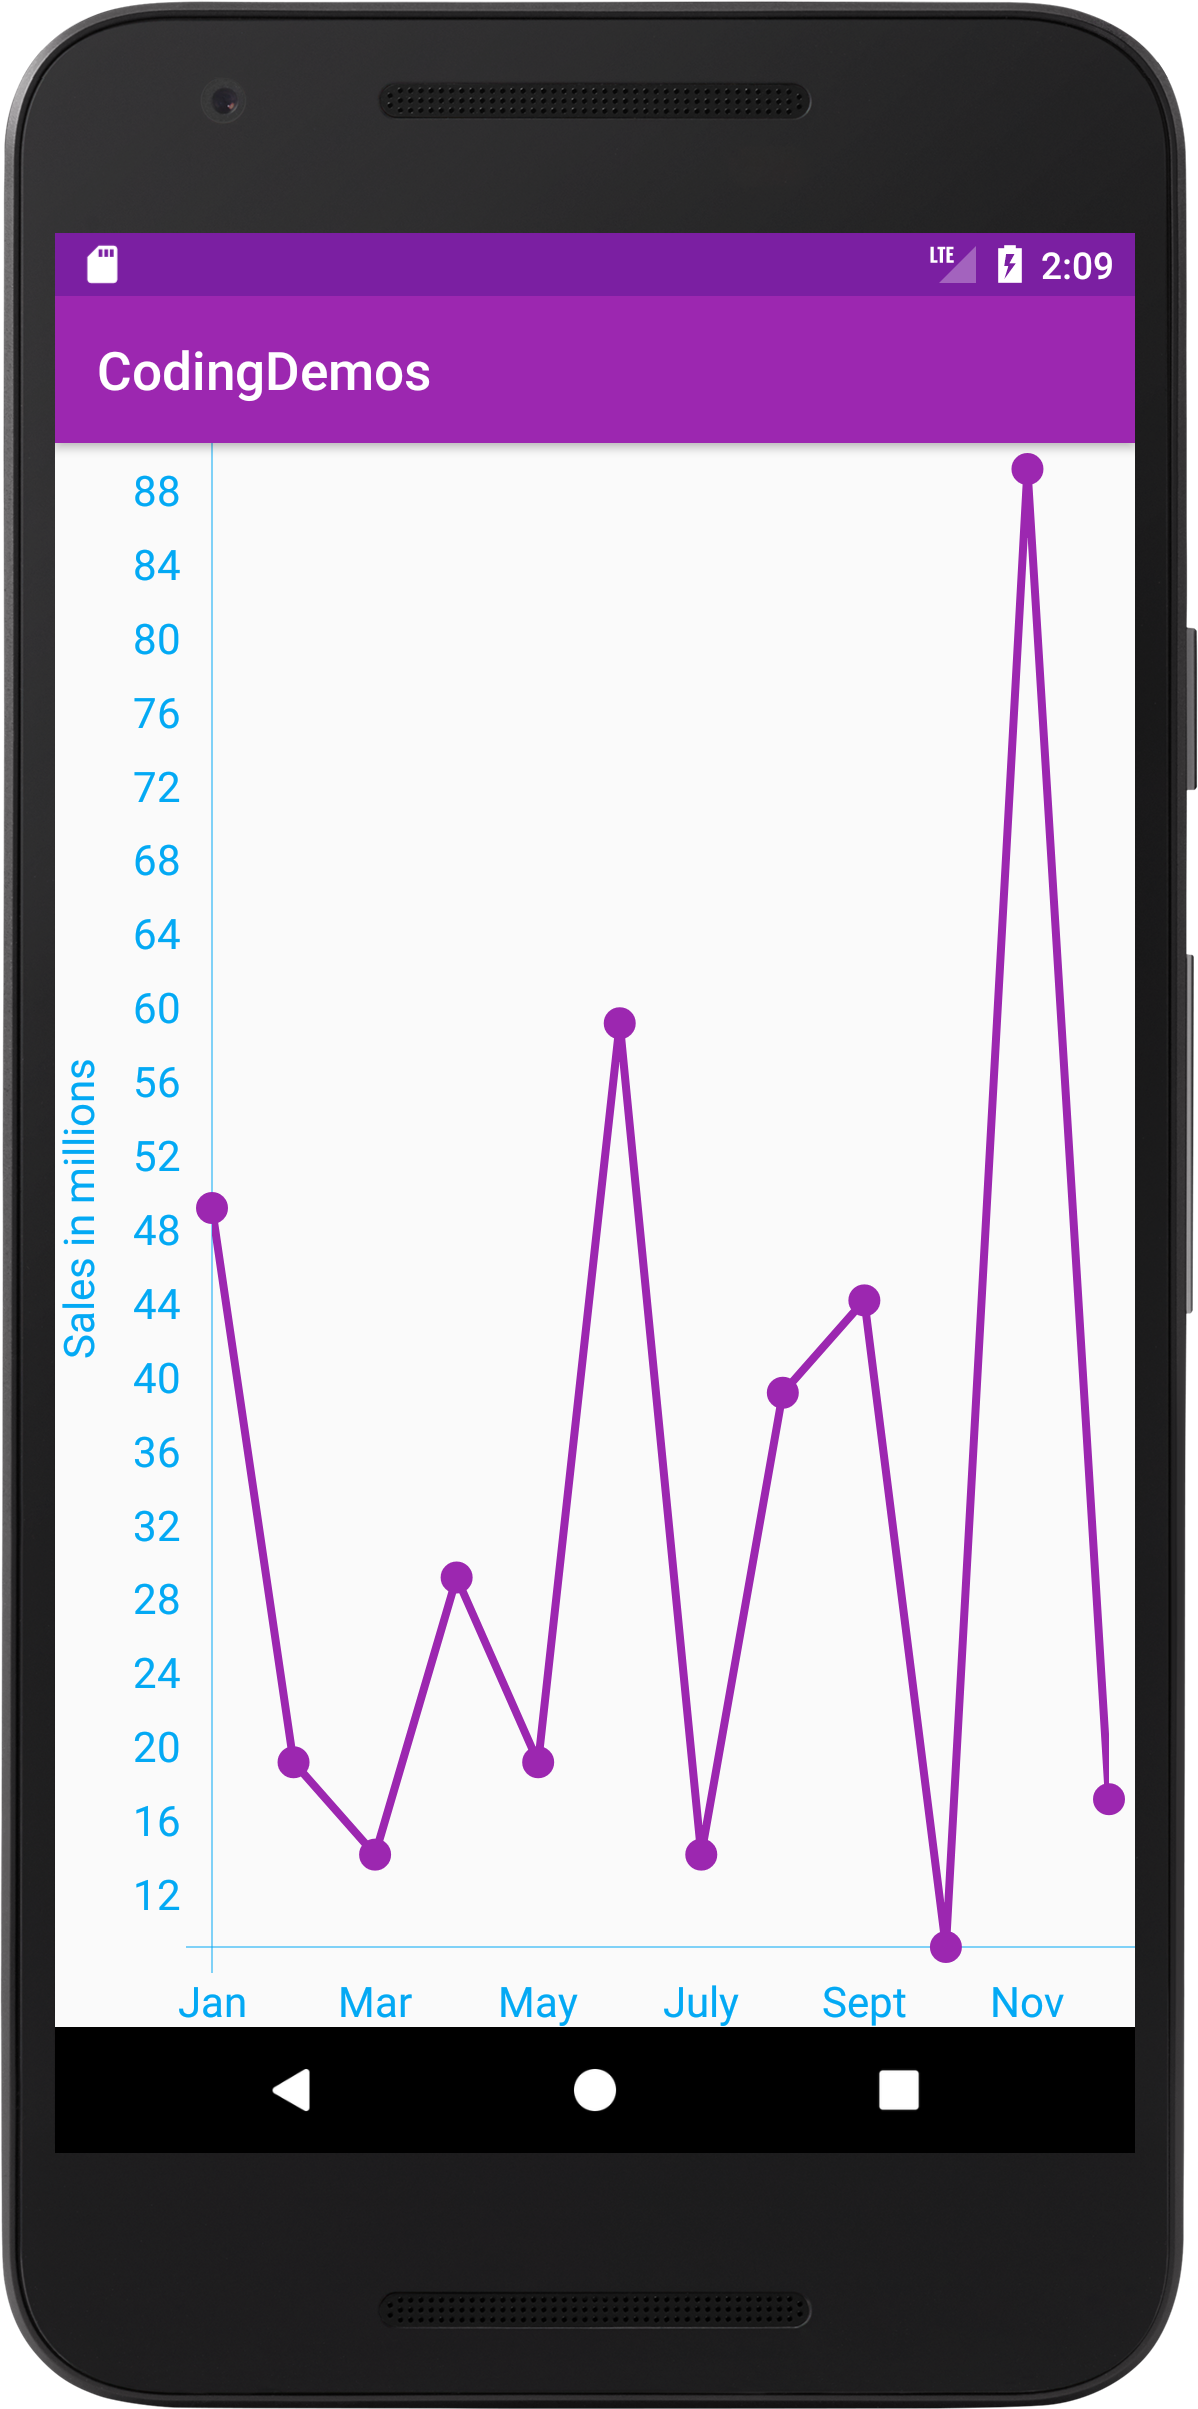
Added label to Y-Axis data in line chart. (Large preview)
33- If you had noticed that Y-Axis data inside the line chart doesn’t show it’s full data based on what you initialized in the beginning. You can fix it by adding the following code.
Viewport viewport = new Viewport(lineChartView.getMaximumViewport());
viewport.top =110;
lineChartView.setMaximumViewport(viewport);
lineChartView.setCurrentViewport(viewport);
What you did here is you explicitly specified a value that is higher than the Y-Axis actual data which is in this example is (90).
34- Build and run the app to see the changes.
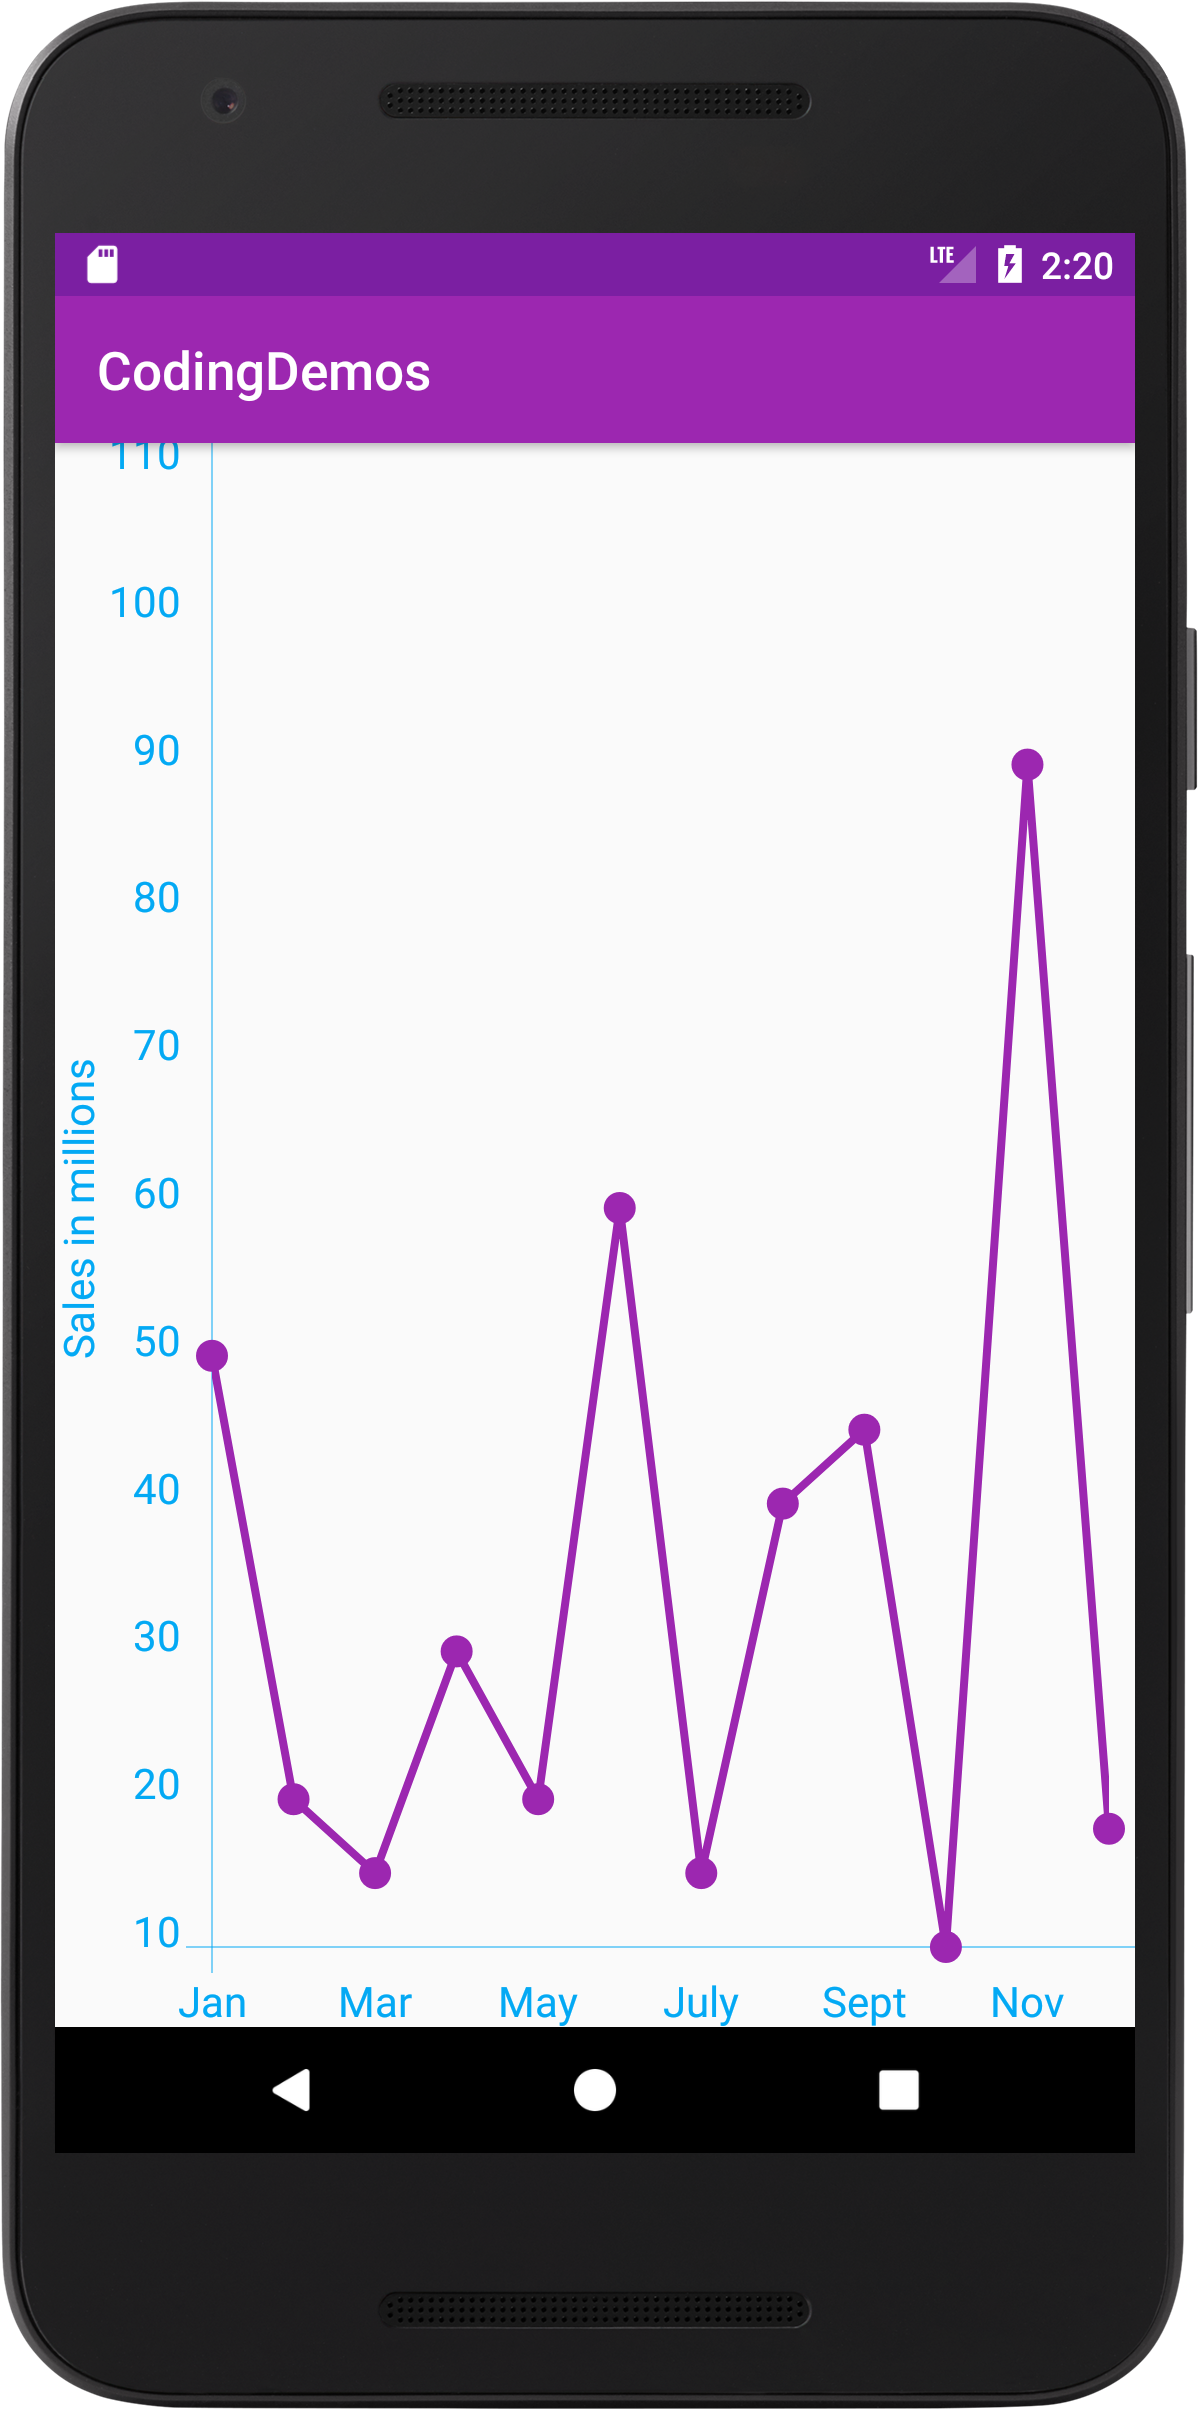
Y-Axis data in line chart is fully shown. (Large preview)
35- Here is the full code for activity_main.xml file.
< ?xml version="1.0" encoding="utf-8"?>
< LinearLayout xmlns:android="http://schemas.android.com/apk/res/android"
  xmlns:app="http://schemas.android.com/apk/res-auto"
  xmlns:tools="http://schemas.android.com/tools"
  android:layout_width="match_parent"
  android:layout_height="match_parent"
  android:orientation="vertical"
  tools:context="com.codingdemos.codingdemos.MainActivity">

  < lecho.lib.hellocharts.view.LineChartView
    android:id="@+id/chart"
    android:layout_width="match_parent"
    android:layout_height="match_parent" />

< /LinearLayout>
36- Here is the full code for MainActivity.java file.
package com.codingdemos.codingdemos;

import android.graphics.Color;
import android.os.Bundle;
import android.support.v7.app.AppCompatActivity;

import java.util.ArrayList;
import java.util.List;

import lecho.lib.hellocharts.model.Axis;
import lecho.lib.hellocharts.model.AxisValue;
import lecho.lib.hellocharts.model.Line;
import lecho.lib.hellocharts.model.LineChartData;
import lecho.lib.hellocharts.model.PointValue;
import lecho.lib.hellocharts.model.Viewport;
import lecho.lib.hellocharts.view.LineChartView;

public class MainActivity extends AppCompatActivity {

    LineChartView lineChartView;
    String[] axisData = {"Jan", "Feb", "Mar", "Apr", "May", "June", "July", "Aug", "Sept",
            "Oct", "Nov", "Dec"};
    int[] yAxisData = {50, 20, 15, 30, 20, 60, 15, 40, 45, 10, 90, 18};

    @Override
    protected void onCreate(Bundle savedInstanceState) {
        super.onCreate(savedInstanceState);
        setContentView(R.layout.activity_main);

        lineChartView = findViewById(R.id.chart);

        List<PointValue> yAxisValues = new ArrayList<PointValue>();
        List<AxisValue> axisValues = new ArrayList<AxisValue>();


        Line line = new Line(yAxisValues).setColor(Color.parseColor("#9C27B0"));

        for (int i = 0; i < axisData.length; i++) {
            axisValues.add(i, new AxisValue(i).setLabel(axisData[i]));
        }

        for (int i = 0; i < yAxisData.length; i++) {
            yAxisValues.add(new PointValue(i, yAxisData[i]));
        }

        List<Line> lines = new ArrayList<Line>();
        lines.add(line);

        LineChartData data = new LineChartData();
        data.setLines(lines);

        Axis axis = new Axis();
        axis.setValues(axisValues);
        axis.setTextSize(16);
        axis.setTextColor(Color.parseColor("#03A9F4"));
        data.setAxisXBottom(axis);

        Axis yAxis = new Axis();
        yAxis.setName("Sales in millions");
        yAxis.setTextColor(Color.parseColor("#03A9F4"));
        yAxis.setTextSize(16);
        data.setAxisYLeft(yAxis);

        lineChartView.setLineChartData(data);
        Viewport viewport = new Viewport(lineChartView.getMaximumViewport());
        viewport.top = 110;
        lineChartView.setMaximumViewport(viewport);
        lineChartView.setCurrentViewport(viewport);
    }

}
37- I hope you find this tutorial helpful and if you have any question please post them in the comment below.
You ‘re awasome ! Thanks for this tutorial . So clean code and expression.
Your welcome 🙂
Thanks man, it’s well explained. Just a question, is there a way to show the data by pressing the dots or at least placing some label near them? Thanks
thankyou <3
Hi
Very new to this
When I place the object in the activity_main.xml I get a “Attribute is missing the Android namespace prefix” error, not sure what this is caused by. Hope this can be fixed as the rest of the tutorial looks great.
Thanks
Kind Regards
When we change linecolor of x axis ,it is not changed according our requirment ,and when we change color of text of x axis it change the text color ,but x axis line color also contain the same color as text color
I want to give both different color to x axis text and x axis line?
is it possible to write multiple lines ?
Hi, I have to refresh the chart in the fragment , not main, but I can’t use
super.onCreate(savedInstanceState);
setContentView(R.layout.activity_main);
Can you help me please?
Hi I tried to do the debug and the app crash in
lineChartView.setLineChartData(data);
What can I do?
(Sorry for my horrible english but I’m Italian)
same problem here..
never mind found it
you should check your the name of your name of your graph
LineChartView chart;
how to add different color to line or how to change the color of the line depending on the values
hi , your tutorial is nice, but how to clear the graph , i used following idea but it did not worked for me
linecharview.getLinechatdata().finish();
Thank you!
Could I ask you one question?
I want to add more lines in one chart. How do I do it?
Excellent!! Thank you
how to draw two lines in graph
How to show 2 line graphs on same view? I want to show 2 products sales in a month, so how can add second product values ?
the graph values(in float ) are showing in y axis points. But i want to set integer points in y axis
Great work but i need to integer axisData can you do that too?
Thanks
Hi, how can I use the information saved in a class?
public class OperacoesAtributos implements Serializable {
private Long id;
private String data;
private String moeda;
private String valor;
private String resultado;
private String numeroDaOperacao;
private String dataTemp;
private String moedaTemp;
private String valorTemp;
private String resultadoTemp;
private String numeroDaOperacaoTemp;
public String getDataTemp() {
return dataTemp;
}
public void setDataTemp(String dataTemp) {
this.dataTemp = dataTemp;
}
public String getMoedaTemp() {
return moedaTemp;
}
public void setMoedaTemp(String moedaTemp) {
this.moedaTemp = moedaTemp;
}
public String getValorTemp() {
return valorTemp;
}
public void setValorTemp(String valorTemp) {
this.valorTemp = valorTemp;
}
public String getResultadoTemp() {
return resultadoTemp;
}
public void setResultadoTemp(String resultadoTemp) {
this.resultadoTemp = resultadoTemp;
}
public String getNumeroDaOperacaoTemp() {
return numeroDaOperacaoTemp;
}
public void setNumeroDaOperacaoTemp(String numeroDaOperacaoTemp) {
this.numeroDaOperacaoTemp = numeroDaOperacaoTemp;
}
public Long getId() {
return id;
}
public void setId(Long id) {
this.id = id;
}
public String getData() {
return data;
}
public void setData(String data) {
this.data = data;
}
public String getMoeda() {
return moeda;
}
public void setMoeda(String moeda) {
this.moeda = moeda;
}
public String getValor() {
return valor;
}
public void setValor(String valor) {
this.valor = valor;
}
public String getResultado() {
return resultado;
}
public void setResultado(String resultado) {
this.resultado = resultado;
}
public String getNumeroDaOperacao() {
return numeroDaOperacao;
}
public void setNumeroDaOperacao(String numeroDaOperacao) {
this.numeroDaOperacao = numeroDaOperacao;
}
}
I would like to use “moeda” and “valor” instead of using the entire months and bar values in the Y direction
Hi,
I’m sorry, I don’t know how to do it
Hi how we can get data from a text file to plot a graph , specifically ECG plotting
Hi Adil, I’m sorry, I don’t know how to do it.